Download
1 / 8
80 likes | 210 Views
NuCo., Inc. Financial Statements for the year ended December 31, 2001. Income Statement Balance Sheet Financial Ratios. Income Statement. Total Revenues $52,200 Cost of Goods Sold 6,000 Gross Margin $46,200 Operating Expenses 9,000 Interest & Income Taxes 15,100

E N D
NuCo., Inc. Financial Statements for the year ended December 31, 2001 • Income Statement • Balance Sheet • Financial Ratios
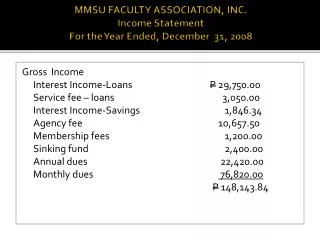
Income Statement • Total Revenues $52,200 • Cost of Goods Sold 6,000 • Gross Margin $46,200 • Operating Expenses 9,000 • Interest & Income Taxes 15,100 • Net Operating Income $21,960 Detailed Statement
Balance Sheet • Assets: • Total Current Assets: $ 61,360 • Total Long Term Assets: 100,000 • Total Assets $161,360
Balance SheetContinued • Liabilities & Stockholders Equity • Total Liabilities $ 45,400 • Total Stockholders Equity 115,960 • Total Liabilities & • Stockholder’s Equity $161,360 • Detailed Statement:
Liquidity Ratios • Current Ratio 153.4 • Quick Ratio 148.4 • Nu Co, Inc. has maintained a very high degree of liquidity, with sufficient assets available for quick expansion.
Asset Management Ratios • Days Sales in Receivables 49.04 • Days Sales in Inventory 60.83 • Asset Turnover 7.44 • As indicated by NuCo’s liquidity ratios, the company is keeping inventory and receivables at low levels, utilizing assets efficiently.
Profitability Ratios • Gross Profit Ratio 88% • Profit Margin 42% • Return on Assets 14% • Return on Equity 19% • Nu Co is providing a good return on investment. Earnings are at or above what might be earned by other ventures.
Stock Return Ratios • Dividend Payout 27% • There is insufficient information to compare NuCo’s stock performance to other companies. EPS and P/E ratios are the most useful for comparison purposes but are not available for this new company. Learn About Antique Cameras Here • Related Sites • Learn About Photography: Academy of Art College • A Description of the Process: Photo Restoration