Download
1 / 19
190 likes | 385 Views
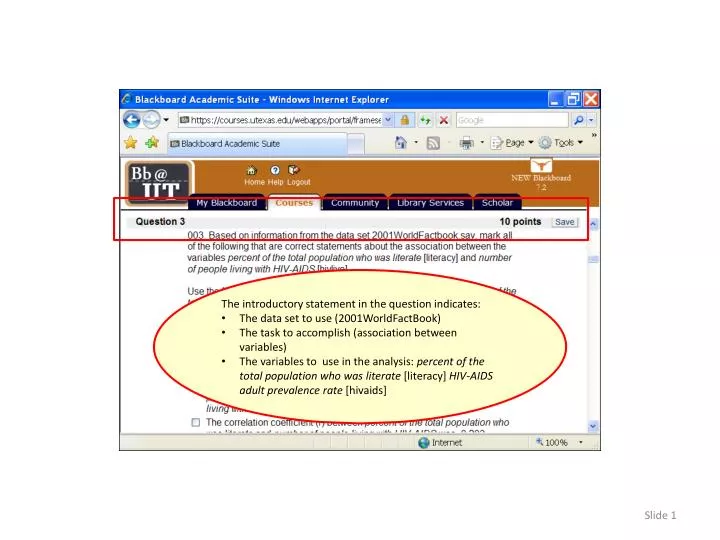
The introductory statement in the question indicates: The data set to use (2001WorldFactBook) The task to accomplish (association between variables) The variables to use in the analysis: percent of the total population who was literate [literacy] HIV-AIDS adult prevalence rate [hivaids].

E N D
The introductory statement in the question indicates: • The data set to use (2001WorldFactBook) • The task to accomplish (association between variables) • The variables to use in the analysis: percent of the total population who was literate[literacy] HIV-AIDS adult prevalence rate [hivaids]
These problem also contains a second paragraph of instructions that provide the formulas to use if our examination of the association between quantitative variables requires us to re-express or transform one or both of the variables.
The first statement concerns the number of valid cases. To answer this question, we produce the statistics using the SPSS Correlate procedure.
To compute correlations, select Correlate > Bivariatefrom the Correlate menu.
First, move the variables hivLive and literacy to the Variables list box. Third, click on the OK button to produce the output. Second, mark the check box for Spearman and leave the check box for Pearson marked.
The Correlations table shows us the number of cases available for computing the correlation – 131.
The number of cases with valid data to analyze the relationship between "percent of the total population who was literate" and "number of people living with HIV-AIDS" was 131, out of the total of 218 cases in the data set. Click on the check box to mark the statement as correct.
The next statement asks us to extract the Pearson correlation coefficient from the SPSS output.
The Correlations table shows us that the Pearson r correlation is -0.203.
The Pearson's r correlation coefficient between "percent of the total population who was literate" [literacy] and "number of people living with HIV-AIDS" [hivlive] was -0.203. Click on the check box to mark the statement as correct.
The next statement asks us to interpret the Pearson correlation coefficient using the guidelines attributed to Tukey.
Using the rule of thumb attributed to Tukey, a correlation between 0.0 and ±0.20 is very weak; ±0.20 to ±0.40 is weak; ±0.40 to ±0.60 is moderate; ±0.60 to ±0.80 is strong; and greater than ±0.80 is very strong, the relationship was correctly characterized as a weak (Pearson's r = -.203). Click on the check box to mark the statement as correct.
The next statement asks us to interpret the Pearson correlation coefficient using the guidelines attributed to Cohen.
Applying Cohen's criteria for effect size (less than ±0.10 = trivial; ±0.10 up to ±0.30 = weak or small; ±0.30 up to ±0.50 = moderate; ±0.50 or greater = strong or large), the relationship was correctly characterized as a weak (Pearson's r = -.203). Click on the check box to mark the statement as correct.
The next statement asks us to interpret the direction of the relationship between the variables. A direct or positive relationship means that the values of the variables change in the same direction, i.e. when one goes up or down, the other goes up or down. An inverse or negative relationship means that the values of the variables move in different directions.
Since the sign of the correlation coefficient was negative (Pearson's r = -.203), the relationship is inverse and the values for the variables move in opposite directions. The statement that "Higher scores on the variable "percent of the total population who was literate" were associated with lower scores on "number of people living with HIV-AIDS"" is correct. Click on the check box to mark the statement as correct.
The final question asks about the impact that re-expressing the data for badly skewed variables has on the correlation coefficient. Operationally, we define badly skewed as a skew value less than or equal to -1.0 or greater than or equal to 1.0
Use Descriptives to compute skew for both variables. • If skew is negative, do square transformation. • If skew is positive, do log transformation. • Compute correlation for transformed variables. If Pearson’s r is higher, the linear fit improves (and the question is correct). If Pearson’s r is lower, the linear fit is not improved (and the question is not correct). • The purpose of this question is to show that we can get an idea of what will happen if we compare pearson’s r to spearman’s rho. If rho is higher, transformations will improve fit; if rho is smaller, transformations reduce fit. • (I only picked problems with substantial differences between r and rho; if the values are close, it is less predictable)
Pearson's r for the the square transformation of "percent of the total population who was literate" [SQ_literacy] and the log transformation of "number of people living with HIV-AIDS" [LG_hivlive] (-0.487) improved the linear fit of the relationship between "percent of the total population who was literate" [literacy] and "number of people living with HIV-AIDS" [hivlive] above what was obtained with the original variables (-0.203). The fact that Spearman's rho was larger than Pearson's r supported the presence of a stronger relationship if one or both variables are re-expressed to reduce skewness. Click on the check box to mark the statement as correct.