Download
1 / 27
270 likes | 411 Views
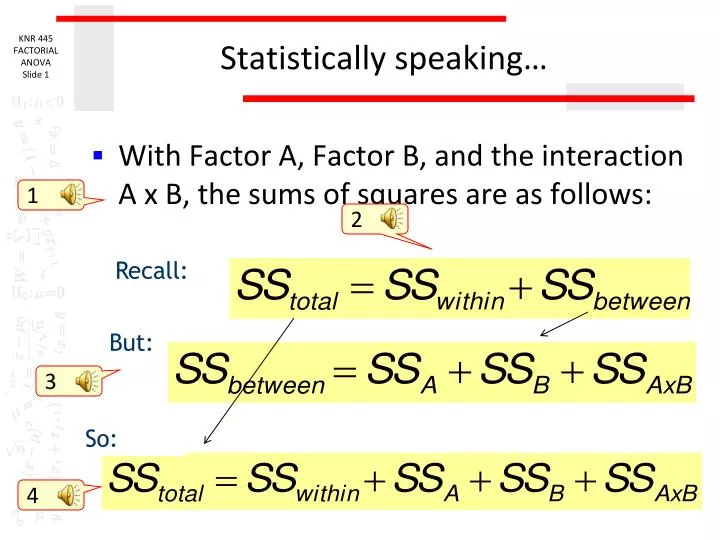
Statistically speaking…. With Factor A, Factor B, and the interaction A x B, the sums of squares are as follows:. 1. 2. Recall:. But:. 3. So:. 4. Statistically speaking…. These are converted to variance estimates by dividing by the d. of f.:. 1. So….

E N D
Statistically speaking… • With Factor A, Factor B, and the interaction A x B, the sums of squares are as follows: 1 2 Recall: But: 3 So: 4
Statistically speaking… • These are converted to variance estimates by dividing by the d. of f.: 1 So… Variance for main effect of factor B Variance for interaction between A & B And: Variance for main effect of factor A
Statistically speaking… • And remember, these are estimates: 1
Statistically speaking… • Or, in another form: Total sum of squares Within-groups SS Between-groups SS SS associated with A 1 SS associated with B SS associated with interaction
Statistically speaking… • So the F-tests are: For Factor A: For Factor B: …and for the interaction: 1
Assumptions • Similar to 1-way ANOVA • Assumptions now stated for cells, not groups. It is assumed that… • Observations are independent (uncorrelated) from one cell to the next • 2 is the same for all cells (homogeneity of variance) • Cell populations are normally distributed • Last 2 are mostly a concern for small sample sizes 1
Assumptions • Note – we have been discussing equal cell sizes throughout. • This is important, as it guarantees independence of statistical effects in the analysis • If cell sizes are unequal, certain adjustments must be made… • These involve reporting different types of sums of squares (Types 1 to 3 as reported in SPSS, Stevens, 1986, 1996) 1 But that is probably a step too far for this class…just make sure your cell sizes are equal!
Factorial ANOVA in SPSS • Data considerations • Dependent variable: interval/ratio, normally distributed within each cell of the analysis) • Independent variables: must be discrete categories • If the independent variable is continuous, the number of categories can be created artificially by doing a median split or quartile split, BUT you’d be better off with regression • Must be independent (see slide 28) 1 2
Factorial ANOVA in SPSS 3. Dependent variable • Data considerations 1. Each row is 1 person/item 2. There is now more than one grouping factor, so “group” is not a good name for either
Factorial ANOVA in SPSS • Data considerations 2. And their individual levels 1. You can/should label both the names of the variables…
Factorial ANOVA in SPSS 2. One dependent variable implies univariate analysis • Performing the analysis 1. The general linear model is the same family of statistical techniques as we used in regression – we could dummy code these variables and get exactly the same answer using regression techniques
Factorial ANOVA in SPSS 1. Here are the variables as listed in the data file • Performing the analysis 2. They just need to be slid over to the right places
Factorial ANOVA in SPSS • Performing the analysis 1. Further options 2. “Plots” lets you request a graph of the 2 factors
Factorial ANOVA in SPSS 1.What you see on choosing “plots” • Performing the analysis 2. Slide over to the right places again…
Factorial ANOVA in SPSS • Performing the analysis 1. If you choose the “post hoc” option, you can specify which main effects you want post hoc tests for…but only those. And we only request for “pressure” here, because…
Factorial ANOVA in SPSS 1. “Options” lets you request descriptives, effect sizes, power statistics, and homogeneity tests. It is the most important box to choose • Performing the analysis 2. Choose only those that I have highlighted below
Factorial ANOVA in SPSS • Performing the analysis 1. Finally, click “ok” once you’ve specified what you want
Factorial ANOVA in SPSS • The output 1. This table shows the allocation of participants to levels of each factor 2. This table shows the descriptive stats – note the balanced design!
Factorial ANOVA in SPSS • The output 1. Here’s the homogeneity test. It is not significant, which means the assumption is met (no problem).
Factorial ANOVA in SPSS • The output 2. 2 – effect sizes – cite in write up (like R2’s for each effect) 1. The ANOVA summary table, showing main effects, interaction, the degrees of freedom, significance, and so on 1. Which are significant?
Factorial ANOVA in SPSS • Eta-squared (2) & partial eta-squared. • 2is exactly like an R2. So it can be treated the same. • As the number of factors in the equation increases, so the SStotalwill increase • So the 2 of any one factor will diminish with the introduction of other factors • All 2 in the analysis will sum to 1 or less (as per R2) 1. From: Levine & Hullet, 2002 (see web site for full citation) 2.
Factorial ANOVA in SPSS • Eta-squared (2) & partial eta-squared. • Partial 2is calculated so that it does not shrink with the introduction of more factors: • For 1-way ANOVA, identical to 2. For multi-factorial designs, can be drastically different • Partial 2 can sum to more than one when there are several strong effects in the analysis. From: Levine & Hullet, 2002 (see web site for full citation) 1. 2.
Factorial ANOVA in SPSS • Eta-squared (2) & partial eta-squared. • SPSS reports partial 2 • What does this imply? • Partial is still ok as a measure of effect size, and is accepted by journals. • But you should be aware that it overestimates effect size when sample size is small (it is a “biased estimator”) • The best estimates are omega () and epsilon ()(neither of which are available in SPSS, of course) – each is unbiased, and so doesn’t change with sample size • So, just keep using partial eta squared, but report it as that, and be aware of the bias. 1. From: Levine & Hullet, 2002 (see web site for full citation)
Factorial ANOVA in SPSS • And now back to...The output 2. If we’d had sig main effects and an interaction, we’d report the means for the main effects but examine whether they are superseded by the interaction (in which case the main effects are not genuine) 1. Here, we have a significant interaction… and that’s all
Factorial ANOVA in SPSS • The output 1. Now the post-hoc tests on the pressure main effect. Ignore, as the main effect was not significant.
Factorial ANOVA in SPSS • The output 1. Now the plot of the cell means making up the interaction.
Factorial ANOVA in SPSS • Next: • Follow-up tests • What to do if the homogeneity assumption is not met • What to do if you have multiple measures on each participant(repeated measures!) 1. Next…


![Public Speaking for New Leaders [session 2]](https://cdn4.slideserve.com/7487995/session-2-presented-by-mark-mccrindle-claire-madden-dt.jpg)