Download
1 / 12
120 likes | 247 Views
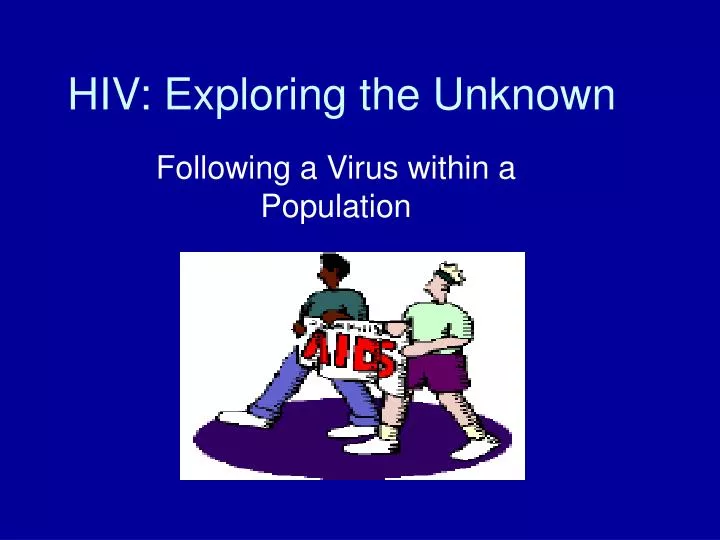
HIV: Exploring the Unknown. Following a Virus within a Population. Hooray for Math and Science!. The Problem: HIV. Use the NetLogo software program to open the HIV model Manipulate the variables to match the question you are trying to look at Run simulations to test your predictions

E N D
HIV: Exploring the Unknown Following a Virus within a Population
Hooray for Math and Science! The Problem: HIV • Use the NetLogo software program to open the HIV model • Manipulate the variables to match the question you are trying to look at • Run simulations to test your predictions + = FUN
The Simulation • The Problem: Does condom use affect the spread of AIDS within a population? • Variables: Percentage of population that uses condoms • How do we measure change? • Varied the percent of population that uses condoms during relations.
How did we measure the change? • Used Netlogo • to collect the data and Fathom to show results. • What predictions can we make? • Condom use will slow the spread of AIDS within a population. • Assumptions the program makes: • People act appropriately when they know they have AIDS (meaning they use condoms). • Condoms provide 100% protection against AIDS • Population is closed • No one is born or dies
Results: Spread of AIDS with no condom use Black Line= data Red Line- function (growth rate)
How do we use this in the classroom? • To show the “relations” between math and science • Incorporating technology, problem solving, and data analysis
Learning Objectives Math 1. Using data collected in an experiment to make predictions about a real world situation2. Use functions we know to match our original graph3. Look at how changing a specific variable will alter the graph
Science Learning Objectives • Understand how a disease is spread within a population • Create a hypothesis • Design an experiment to test their hypothesis
Questions for Reflection: Is there any value in using technology for this? Yep! 2. Is there any value to integrating math and science? When the kids wonder “why is this important?” you can show them exactly why a specific topic is relevant to their lives.
Is there added value in these innovations for reaching diverse populations? Not necessarily: people not proficient in computer skills would have great difficulty navigating these programs
This ultra-cool presentation was brought to you by: Chad Hay Ben Jablonski Karyn Junker Carly Thomas Britt Wilms