Download
1 / 11
110 likes | 115 Views
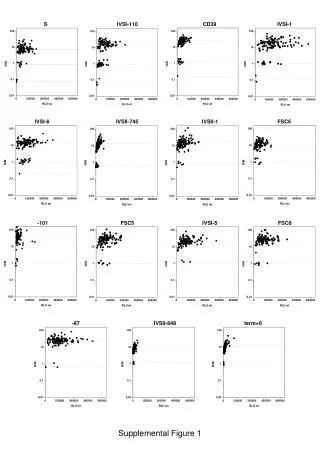
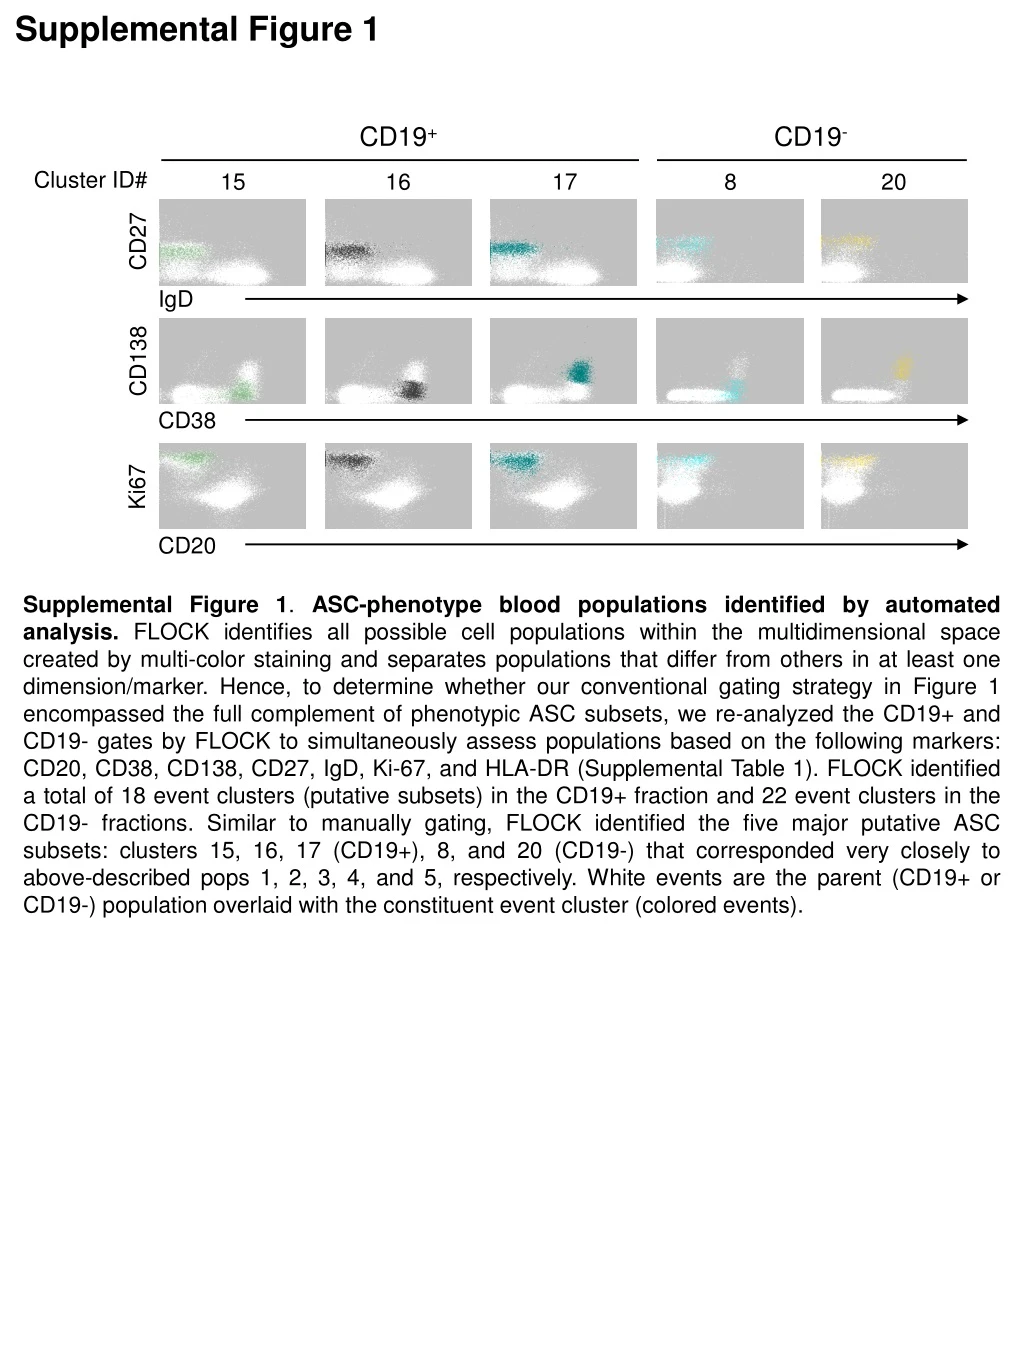
FLOCK analysis was used to identify and separate putative ASC subsets based on markers CD20, CD38, CD138, CD27, IgD, Ki-67, and HLA-DR. FLOCK identified a total of 18 event clusters in CD19+ and 22 event clusters in CD19- fractions, including the major ASC subsets clusters 15, 16, 17 (CD19+), 8, and 20 (CD19-). Backgating and mutation rate analysis were also performed.

E N D
Supplemental Figure 1 CD19+ CD19- Cluster ID# 15 16 17 8 20 • Supplemental Figure 1. ASC-phenotype blood populations identified by automated analysis. FLOCK identifies all possible cell populations within the multidimensional space created by multi-color staining and separates populations that differ from others in at least one dimension/marker. Hence, to determine whether our conventional gating strategy in Figure 1 encompassed the full complement of phenotypic ASC subsets, we re-analyzed the CD19+ and CD19- gates by FLOCK to simultaneously assess populations based on the following markers: CD20, CD38, CD138, CD27, IgD, Ki-67, and HLA-DR (Supplemental Table 1). FLOCK identified a total of 18 event clusters (putative subsets) in the CD19+ fraction and 22 event clusters in the CD19- fractions. Similar to manually gating, FLOCK identified the five major putative ASC subsets: clusters 15, 16, 17 (CD19+), 8, and 20 (CD19-) that corresponded very closely to above-described pops 1, 2, 3, 4, and 5, respectively. White events are the parent (CD19+ or CD19-) population overlaid with the constituent event cluster (colored events). CD27 IgD CD138 CD38 Ki67 CD20
Supplemental Figure 2 SSC-A FSC-W SSC-W PE-Cy7 CD19 FSC-A FSC-H SSC-H PE-Cy5.5 CD3/CD14 APCeF780 CD27 APC CD138 # Cells FITC IgD V450 CD38 PE BLIMP-1 • Supplemental Figure 2. Backgating of Pop 4 showing similar FSC and SSC properties as other ASC populations. Backgating analysis for Blimp-1+ Pop 4 (CD19-CD38hiCD138-). PBMC from a subject 6 days post receiving the Tetanus vaccine were stained for intracellular Blimp-1 expression as well as ASC markers. Numbers indicate frequencies of the parent population.
Supplemental Figure 3 (A,B) A 10.0 7.5 5.0 Mean Mutation 2.5 0.0 SWM Pop 1 Pop 2 Pop 3 Pop 4 Pop 5 B 0.5 0.4 0.3 0.2 Deviation from Mean Mutation 0.1 0.0 -0.0 SWM Pop 1 Pop 2 Pop 3 Pop 4 Pop 5 Supplemental Figure 3. (A) Mean mutation rate taken from an average of all clone mutation rates. (B) An average of how much each population deviates from the average mutation rate within each clone. For this value, the mean mutation rate of each population within each individual clone is subtracted from the mean mutation rate of that clone. Those values are then averaged. This value implies that switched memory are typically the least mutated within individual clones, followed by Pop 2 and Pop 5. Pops 1, 3, and 4 are the most mutated within clones. This analysis does not differentiate isotypes. (C) Phylogenetic trees were constructed from the largest clone using Phylip by examining nucleotide sequences after filtering for quality and removing singletons. The germline node is shown as a green diamond and each node on the tree is determined to be a unique sequence containing a single mutation from the node before it. Nodes colored in red contain sequences from the designated population (seen to the right of each plot), while nodes in blue contained sequences from the other populations, but not the designated population for that particular plot. Larger circles designate nodes with more instances of the sequence, while smaller circles designate nodes with only one or a few instances.
Supplemental Figure 3 (C) Pop 2 Pop 3 Pop 4 Pop 5
Supplemental Figure 4 10 5 Pop 2 PC2 (6.98%VE) 0 Pop 5 Pop 3 -5 Supplementary Figure 4. Principal Component Analysis of 2 of Pop 2, Pop 3, and Pop 5. The principal component analysis of the genes included in the hierarchical cluster (Figure 6A) was performed. PC1 explains 56.6% of the variance. PC2 explains 6.98% of the variance. Pop 2 (light blue) and Pop 3 (dark blue) are separated from Pop 5 (green) samples by PC1. Pop 2 and Pop 3 are separated by PC2. -10 -50 -10 10 -30 PC1 (56.6%VE)
Supplemental Figure 5 (A-F) A Allograft Rejection All Genes Genes Correlated with PC1 2 2 3 3 5 5 B Coagulation All Genes Genes Correlated with PC1 2 2 3 3 5 5 C Complement Genes Correlated with PC1 All Genes 2 2 3 3 5 5 D DNA Repair Genes Correlated with PC1 All Genes 2 2 3 3 5 5 E Heme Metabolism Genes Correlated with PC1 All Genes 2 2 3 3 5 5 F IFNG Response All Genes Genes Correlated with PC1 2 2 3 3 5 5
Supplemental Figure 5 (G-L) G Mitotic Spindle Genes Correlated with PC1 All Genes 2 2 3 3 5 5 H MTORC1 Signaling All Genes Genes Correlated with PC1 2 2 3 3 5 5 I Peroxisome All Genes Genes Correlated with PC1 2 2 3 3 5 5 J Spermatogenesis All Genes Genes Correlated with PC1 2 2 3 3 5 5 K UV Response Up All Genes Genes Correlated with PC1 2 2 3 3 5 5 L Xeno Metabolism All Genes Genes Correlated with PC1 2 2 3 3 5 5
Supplemental Figure 5 Supplementary Figure 5. Two-Way Hierarchical Clusters of Incongruous Hallmark Gene Sets in the GSEA of pops 2, 3, and 5 and the Top Loading Genes of the First Principal Component for Each of 12 Discrepant Gene Sets. Twelve gene sets were incongruous between GSEA and PC1 pathway analysis. The reason for this that the genes driving the PC1 present a contradictory result to the GSEA, which takes into account all of the genes within the pathway. This figure presents the two-way hierarchical clusters of 12 Hallmark gene sets. On the x-axis are genes within the denoted gene set and on the y-axis are the three populations of peripheral blood ASCs; where pop 2 is denoted by the number 2, pop 3 is denoted by the number 3, and pop 5 is denoted by the number 5. In the left column are are the two-way hierarchical clusters of the gene expression of the genes are the genes that are highly correlated (>0.9) with PC1 of each pathway. On the right are the two-way hierarchical clusters of all of the genes within each gene set; underneath each of these is a red bar to denote the genes that contribute to PC1 (on the left). (A) Describes genes within the Hallmark Allograft Rejection gene set. (B) Describe genes within the Hallmark Coagulation Signaling gene set. (C) Denotes the Hallmark Complement gene set. (D) Displays the Hallmark DNA Repair. (E) Denotes genes in the Hallmark Heme Metabolism gene set. (F) Shows gene expression for Hallmark IFNG Response gene set. (G) Denotes the Hallmark Mitotic Spindle gene set. (H) Displays the Hallmark MTORC1 Signaling gene set. (I) Describes the Hallmark Peroxisome gene set. (J) Shows the Hallmark Spermatogenesis gene set. (K) Describes the Hallmark UV Response Up gene set. (L) Provides expression of the Hallmark Xenobiotic Metabolism gene set.
Supplemental Figure 6 A C Day 0 CD19+ 99.9% CD138+ 46.1% CD19 CD138 B CD19/DAPI DAPI CD19 CD138 CD138/DAPI Day 1 Day 14 Supplementary Figure 6. Acquisition of maturation marker, CD138, of cultured blood ASC.(A)Blood ASC (CD19+CD27hiCD38hi) were FACS-sorted from a healthy donor. Percentage of post-sorted ASC getting off the sorter (Day 0) was immediately analyzed by flow cytometry for surface markers CD19 or CD138. (B) ASC cultured in the in vitro BM mimic (in the presence of exogenous APRIL) were collected at Day 1 and Day 14 of cultures and subjected to confocal imaging for surface markers CD19 (green) or CD138 (red). Nuclei were counterstained with DAPI (blue). Representative images shown. (C) Frequencies (% DAPI) of blood ASC positive for CD19 or CD138 shown in A and B, which show similar CD19 staining (from 99% at day 0 to 92% at day 14) (left) and increase of CD138 (from 46% at day 0 to 99% at day 14) (right). Confocal imaging performed by Olympus FV1000 inverted microscope (with acquisition software Fluoview v4.2). All images captured at 40x magnification.
Supplemental Table 2 Table S2. List of pathways.