Download
1 / 20
200 likes | 205 Views
Magnitude and Completeness Assessment of the ISC-GEM Global Instrumental Earthquake Catalogue (1900-2009). D. Di Giacomo, I. Bondár, E.R. Engdahl, D.A. Storchak, W.H.K. Lee, P. Bormann. IASPEI 2013, Gothenburg. Motivation.

E N D
Magnitude and Completeness Assessment of the ISC-GEM Global Instrumental Earthquake Catalogue (1900-2009) D. Di Giacomo, I. Bondár, E.R. Engdahl, D.A. Storchak, W.H.K. Lee, P. Bormann IASPEI 2013, Gothenburg
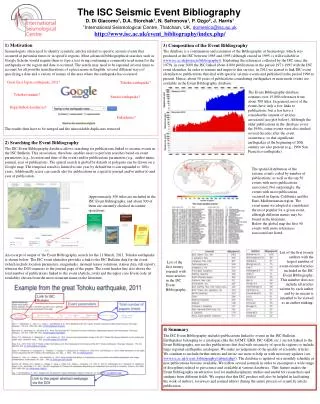
Motivation Seismic hazard studies need accurate knowledge of the spatial distribution of seismicity and the magnitude-frequency relation. Existing catalogues for past century, however, are compilations of different sources covering different time periods, and therefore contain inhomogeneous locations and magnitudes. There is the need for an improved global instrumental catalogue for large earthquakes spanning the entire 100+ years period of instrumental seismology. IASPEI 2013, Gothenburg
Project in a nutshell • Cut-off magnitudes: • 1900-1917: MS≥7.5 worldwide + smaller shallow events in stable continental areas • 1918-1959: MS≥6¼ • 1960-2009: MS≥5.5 This Catalogue is unique because it contains homogeneous locations and magnitude estimates with the estimates of uncertainty for the entire period 1900-2009 done using the same tools and techniques to the extent possible. • Collecting, digitising and processing data from a multitude of historical sources for earthquakes occurred up to 1970; • 110 years of relocated earthquake hypocenters; • recomputed MS and mb values for relocated events using uniform procedures; • MW values (with uncertainty) based on: • seismic moment from GCMT (mainly 1976-2009); • seismic moments from the literature search for earthquakes up to 1979; • proxy values based on recomputed MS and mb in other cases using appropriate empirical relationships. 3 IASPEI 2013, Gothenburg
Phase and Amplitude Data Collection Period Body Wave Arrival Times Body/Surface Wave Amplitudes 1900-1917 1918-1959 1960-1970 1971-2009 ~10000 ~730,000 Quality station bulletins DIGITALLY AVAILABLE, ISC database DIGITALLY NOT AVAILABLE BEFORE THIS PROJECT Major Sources of Phase Data: • Gutenberg Notepads (1904-1917) and BAAS (1913-1917) • ISS Bulletins (1918-1963) See Poster S101PS.02 4 IASPEI 2013, Gothenburg
Earthquake Location Procedure • Location method: • Determine event depth using the EHB style of processing (Engdahl, van der Hilst and Buland, 1998): • comprehensive analysis of near-event surface reflections off the earth surface inland and ocean bottom or water surface in the oceans; • Station patch corrections; • Use the new ISC location algorithm (Bondár and Storchak, 2011) with earthquake depths fixed to those from EHB analysis: • more accurate epicentre locations due to correlated error structure taken into account (removes bias from uneven geometrical positioning of stations) • independent depth confirmation using depth phase stacking; See Poster S101PS.01 IASPEI 2013, Gothenburg
Mwfrom GCMT and literature search MW from GCMT is available from 1976 (plus some deep earthquakes between 1962 and 1975). For 967 relocated earthquakes direct measurements of M0 were compiled from the literature. For the remaining relocated earthquakes, proxy MW values are obtained from the recomputed MS and mb using new empirical relationships… 6
MS and mb recomputation The recomputed MS and mb benefit from:1) amplitude data added up to 1970;2) station magnitudes consistent with newly computed hypocentre solutions; 3) homogeneous magnitude calculations following the IASPEI standards;4) network magnitudes based on several station measurements using alpha-trimmed median (α = 20%) of the single station magnitudes (no network magnitude based on one station only). 7 IASPEI 2013, Gothenburg
Comparisons of MS with Abe and G&R catalogues Good fit with Abe’s catalogue (left), whereas with G&R catalogue (right) our recomputed MS confirm an average bias of ~0.2 magnitude units, as already pointed out by Engdhal&Villaseñor (2002). 8 IASPEI 2013, Gothenburg
Mw proxy based on recomputed MS • Data population strongly dominated by earthquakes with magnitude below 6; • The relationship between MS and MW is not linear over the entire distribution; • Median values for separated bins (dashed black line) suggest that a non-linear model could fit well the data. Num=17472 9 IASPEI 2013, Gothenburg
MW proxy based on recomputed MS The histogram equalization defines magnitude bins varying width so that each bin contains the same number of data points. For each bin a randomly chosen 10% of the data is assigned to the validation dataset, while the 90% to the training dataset used to obtain the regression model. 10
MW proxy based on recomputed MS We applied a non-linear regression using an exponential model of the form My = exp(a+b*Mx)+c (EXP, purple). • The exponential model follows well the median values curve over the entire population. • Proxy MW vs true MW(=10% of the original population not used for deriving the model). 11 IASPEI 2013, Gothenburg
MW proxy based on recomputed mb • The exponential model follows well the median values curve close to the saturation level of mb. 12 IASPEI 2013, Gothenburg
Magnitude composition: Centennial vs ISC-GEM catalogue Centennial catalogue ISC-GEM catalogue 13 IASPEI 2013, Gothenburg
Magnitude composition: timeline of direct/proxy Mw Direct values of Mw are prominent in the modern period. Considering only great or near-great earthquakes (Mw ≥ 7.75), the entire catalogue includes 175 events with 86 direct Mw compiled from the bibliographic search, 52 from the GCMT, and for the remaining 37 a proxy Mw was computed. 14 IASPEI 2013, Gothenburg
ISC-GEM catalogue: time-magnitude distribution Before 1918, only large earthquakes are included. Starting with 1918 the number of events in the catalogue starts to “take-off”. Black solid line is the cumulative number of earthquakes. 15
Frequency-Magnitude distributions • Seismicity rates for large (M>7.5-7.6) earthquakes better assessed considering a long time window (violet) • For moderate earthquakes the modern period (red) is a better basis for magnitude-frequency studies, whereas for strong to major shallowearthquakes the entire ISC-GEM catalogue may be used 16
Conclusions • We recomputed MS and mb using uniform procedures, and new non-linear relationships are used to obtain MW proxies when direct computation of M0 from GCMT or literature is not available. Thus, only four sources of Mw were used in the catalogue magnitude composition. • The completeness estimation is 5.6 for 1964-2009 and 6.4 between 1900-1963. Further work is necessary to improve the completeness pre-1964. • The ISC-GEM Global Instrumental Earthquake Catalogue represents the final product of one of the ten global components in the GEM program, and is available at the ISC website (www.isc.ac.uk). IASPEI 2013, Gothenburg
THANK YOU IASPEI 2013, Gothenburg
Appendix 19 IASPEI 2013, Gothenburg
Mw proxy based on recomputed mb We applied both the GOR (green) and a non-linear regression using an exponential model of the form My = exp(a+b*Mx)+c (EXP, purple). • The exponential model follows well the median values curve close to the saturation level of mb. • Proxy MW vs true MW(=10% of the original population not used for deriving the models), show how EXP model works better than GOR models, especially for MW < 6. 20