Download
1 / 1
10 likes | 98 Views
VASA: Visual Analytics for Security Applications Mission Need

E N D
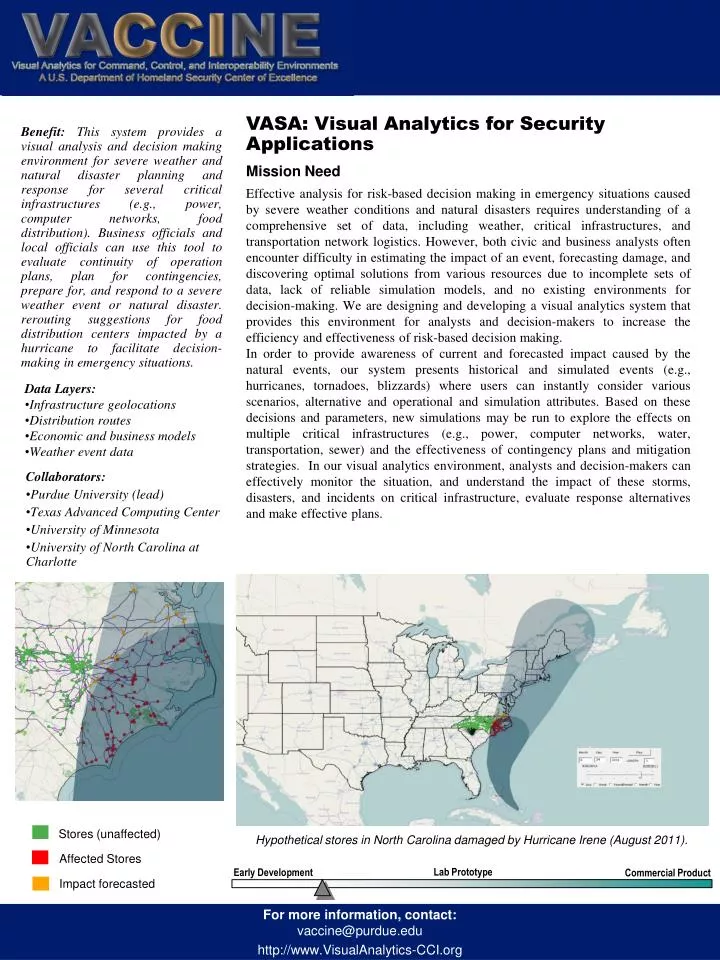
VASA: Visual Analytics for Security Applications Mission Need Effective analysis for risk-based decision making in emergency situations caused by severe weather conditions and natural disasters requires understanding of a comprehensive set of data, including weather, critical infrastructures, and transportation network logistics. However, both civic and business analysts often encounter difficulty in estimating the impact of an event, forecasting damage, and discovering optimal solutions from various resources due to incomplete sets of data, lack of reliable simulation models, and no existing environments for decision-making. We are designing and developing a visual analytics system that provides this environment for analysts and decision-makers to increase the efficiency and effectiveness of risk-based decision making. In order to provide awareness of current and forecasted impact caused by the natural events, our system presents historical and simulated events (e.g., hurricanes, tornadoes, blizzards) where users can instantly consider various scenarios, alternative and operational and simulation attributes. Based on these decisions and parameters, new simulations may be run to explore the effects on multiple critical infrastructures (e.g., power, computer networks, water, transportation, sewer) and the effectiveness of contingency plans and mitigation strategies. In our visual analytics environment, analysts and decision-makers can effectively monitor the situation, and understand the impact of these storms, disasters, and incidents on critical infrastructure, evaluate response alternatives and make effective plans. Benefit: This system provides a visual analysis and decision making environment for severe weather and natural disaster planning and response for several critical infrastructures (e.g., power, computer networks, food distribution). Business officials and local officials can use this tool to evaluate continuity of operation plans, plan for contingencies, prepare for, and respond to a severe weather event or natural disaster. rerouting suggestions for food distribution centers impacted by a hurricane to facilitate decision-making in emergency situations. • Data Layers: • Infrastructure geolocations • Distribution routes • Economic and business models • Weather event data • Collaborators: • Purdue University (lead) • Texas Advanced Computing Center • University of Minnesota • University of North Carolina at Charlotte Stores (unaffected) Hypothetical stores in North Carolina damaged by Hurricane Irene (August 2011). Affected Stores Lab Prototype Early Development Commercial Product Impact forecasted January/2008 For more information, contact:vaccine@purdue.edu http://www.VisualAnalytics-CCI.org