Download
1 / 11
110 likes | 147 Views
Graphs in Science. You Can Do It!!!. Graph. A picture of your data that reveals patterns or trends that words or data tables cannot. Bar Graphs. Line Graphs. Cool. Yes Science Rules. Line Graphs.

E N D
Graphs in Science You Can Do It!!!
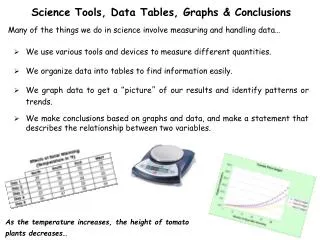
Graph • A picture of your data that reveals patterns or trends that words or data tables cannot.
Line Graphs • Are used to display data to show how one variable (DEPENDENT VARIABLE) changes in response to another variable (INDEPENDENT VARIABLE).
Plotting a line Graph • 1. Draw the axes • Horizontal axis (x-axis): Independent Variable • Vertical axis (y-axis): Dependent Variable • 2. Label the axes: • Independent Variable (x ) and Dependent Variable (y) • Include UNITS of Measure • 3. Create a scale • Needs to cover the ranges of values from your data • Space numbers equally along axes
Plotting a line Graph • 4. Plot the data • Using coordinate pairs (data) • Data Point: the point showing the location of the coordinate pairs • 5. Draw a line of BEST FIT • A smooth line that reflects the general pattern of a graph • 6. Add a title • Identify the variables or relationship shown in the graph.
Line of best Fit Emphasizes the overall trend shown by all the data taken as a whole
Slope • The slope of a graph line tells you how much y changes for every change in x.