Download
1 / 7
70 likes | 269 Views
Correlation. Correlation is the relationship between two quantitative variables. Correlation coefficient (r) measures the strength of the linear relationship between two variables.

E N D
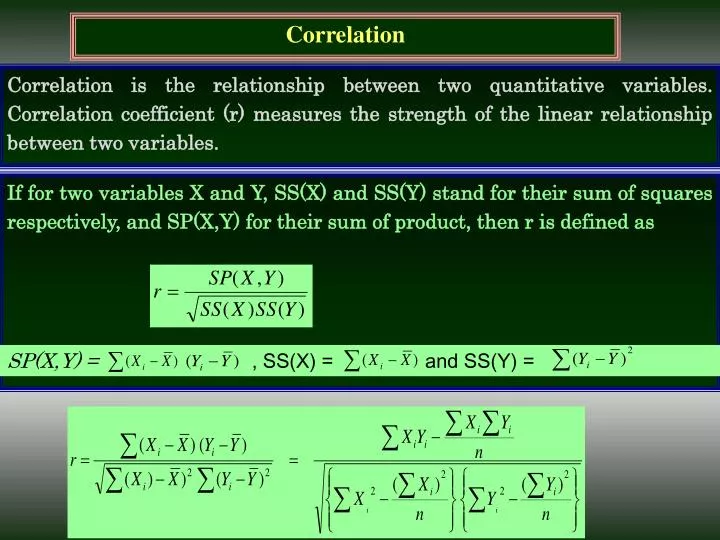
Correlation Correlation is the relationship between two quantitative variables. Correlation coefficient (r) measures the strength of the linear relationship between two variables. If for two variables X and Y, SS(X) and SS(Y) stand for their sum of squares respectively, and SP(X,Y) for their sum of product, then r is defined as SP(X,Y) =, SS(X) = and SS(Y) =
Correlation • Types of correlation: • Perfect positive correlation • Perfect negative correlation • Partial/Moderately positive correlation • Partial/Moderately negative correlation • Absolutely no correlation Positive correlation Height
Correlation The statistical significance of r is tested using a t-test. The null hypothesis is that in whole population there is no relationship between y and x. The hypotheses for this test are: H0: r= 0Ha: r <> 0 We refer this value to the t distribution table with df = n – 2, to find p-value. A low p-value for this test (less than 0.05 for example) means that there is evidence to reject the null hypothesis in favor of the alternative hypothesis, or that there is a statistically significant relationship between the two variables. with df = n – 2
x y x2 y2 xy 65 67 4225 4489 4355 66 68 4356 4624 4488 67 66 4489 4356 4422 68 69 4624 4761 4692 69 72 4761 5184 4968 70 72 4900 5184 5040 71 69 5041 761 4899 Correlation The height and weight of 7 students are given below. Calculate the coefficient of correlation (‘r’ value) between height and weight. Height (in inch): 65, 66, 67, 68, 69, 70, 71 Weight (in pound): 67, 68, 66, 69, 72, 72, 69
Correlation = 0.67 t = 0.67 x = 2
Linear regression Linear regression is used to develop an equation (a linear regression line) for predicting a value of the dependent variables given a value of the independent variable. A regression line is the line described by the equation and the regression equation is the formula for the line. The regression equation is given by: Y = a + bX Where X is the independent variable, Y is the dependent variable, a is the intercept and b is the slope of the line.
Linear regression - Exercise y = a + bx; y = 2.0 + 0.50x Now we can draw the best fitting line with this equation.