Download

1 / 12
140 likes | 395 Views
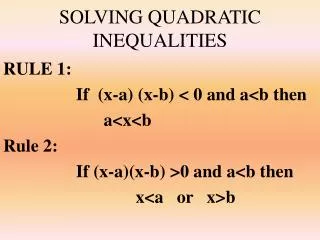
U4.7 Graph and Solve Quadratic Inequalities. Practice 1-6: Factoring Factor each problem completely!. Two Variable Quadratic Inequalities. Two Variable Quadratic Inequalities.

E N D
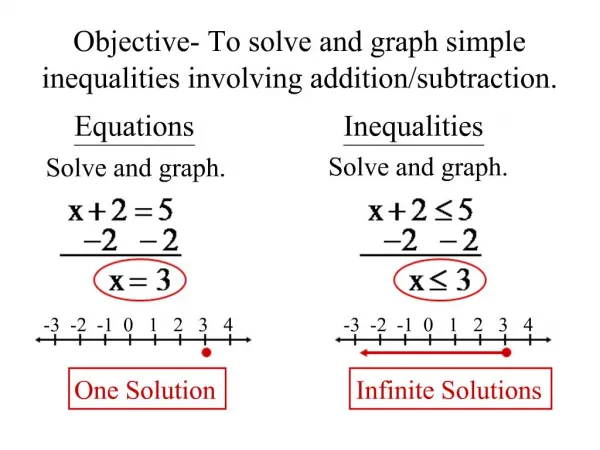
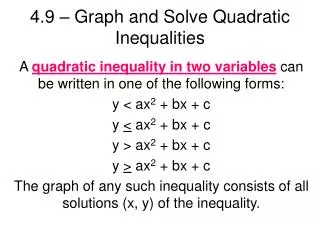
Two Variable Quadratic Inequalities Two Variable Quadratic Inequalities Note: All of these are examples of two variable quadratic inequalities written in standard form. Quadratic inequalities might be expressed in factored or vertex form as well.
Steps for Graphing Two Variable Quadratic Inequalities To graph a two variable quadratic inequality: 1. Graph the quadratic equation. Make a dashed line for < or >. Make solid for < or >. 2. Test a point (x, y) inside the parabola to determine whether or not the point is a solution of the inequality. 3. Shade the region inside the parabola if the point from step 2 is a solution. Shade outside the parabola if the point from step 2 is not a solution. Remember Quadratic graphs must have 5 points when graphing and must include the vertex!
Example 1 Graph: Test: Pick a point : (0,0) Shade the region where the true solution will be. (inside the parabola)
Example 2: Real Life • A manila rope used for rappelling down a cliff can safely support a weight W (in pounds) provided: where d is the rope’s diameter (in inches). Graph the inequality. Graph will only be in 1st Quadrant because the diameter of the rope can not be negative. Less than or equal to means the curve will be solid and shaded below. Be sure to test a point to check that the shading is in the proper place.
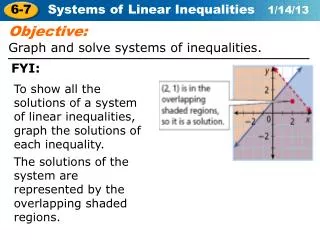
Example 3: System of Quad. Ineq. • Graph the system of quadratic inequalities. • Graph the red inequality • Graph the black inequality • Identify the region where the two graphs overlap. This region is the graph of the system. • Are the boundary lines part of the solution? Only the red ones!
Graph the inequality Practice. Graph the inequality. 1. 2.
One variable Quadratic Inequalities Different forms: Note: All of these are examples of one variable quadratic inequalities written in standard form. Quadratic inequalities might be expressed in factored or vertex form as well.
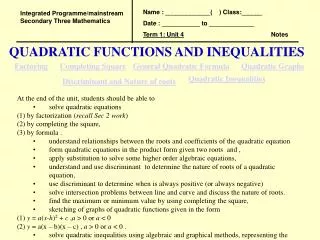
Steps for Solving One Variable Quadratic Inequalities To solve a one variable quadratic inequality: 1. Move all terms to one side. 2. Try to factor, or use the quadratic formula. 3. Test points on each side of the critical x –values. 4. Determine where the values satisfy the inequality. Remember Quadratic graphs must have 5 points when graphing and must include the vertex!
-3 5 - + + -3 5 Example 4: Solve Algebraically • Move all terms to one side. • Try to factor, or use the quadratic formula • Test points on each side of the critical x –values. • Determine where the values satisfy the inequality. The solution is: x < -3 or x > 5.
< 0 or = 0 Example 5: Solve Using a Table 1. Move everything to one side. 2. Make a table by hand or by using your calculator. 3. Use the table to find when the function will be less than or equal to 0. The solution of the inequality will be the x values that make the function 0. So, The solution of the inequality is :