Download
1 / 26
260 likes | 378 Views
Using experience and market curves to inform energy technology subsidy policy Eric Williams, Schuyler Matteson Rochester Institute of Technology Seth Herron Arizona State University. The Golisano Institute of Sustainability. Academic Programs: Ph.D. in Sustainability

E N D
Using experience and market curves to inform energy technology subsidy policy Eric Williams, Schuyler Matteson Rochester Institute of Technology Seth Herron Arizona State University
The Golisano Institute of Sustainability • Academic Programs: • Ph.D. in Sustainability • M.S. in Sustainable Systems • M. Sustainable Architecture • Core Courses for PhD and M.S.: • Fundamentals of Sustainability Science • Industrial Ecology • Risk Analysis • Economics of Sustainability • Multicriteria Sustainable Systems Analysis • Technology, Policy and Sustainability • New building: • LEED platinum (in process) • Fuel cell, PV, wind, ground source heat pump, green roof, sensors ….
Cheap renewable & ultra-efficient energy technologies would do great things for sustainability Working hypothesis
Government interventions to make energy technologies cheaper • Investment in Research and Development, e.g. Dept. of Energy • Adoption/efficiency targets – e.g. biofuel, CaFÉ standards • Economic subsidies – e.g. federal, state, and utility support for solar, wind fuel cells, electric vehicles, etc.
State of knowledge of future economic performance of energy technologies Current state? Perfect forecasting: invest $X.XXX to get technology with price $Y.YYY Zero future knowledge Current state? Extensive and iterated analysis w/ uncertainty Zero use: roll dice Use of knowledge in policy-making
Retrospective forecasting – e.g. experience curves Expert elicitation Scenario analysis Forecasting technological progress
C(P) = C0 (P/P0)-α C = cost of production per energy unit (e.g., $/Wp or $/kWh) P= cumulative production (e.g. total watt capacity of solar cells produced) α is empirical constant Learning rate given by α = - log2(1-LR) LR= % cost reduction each doubling of production Experience Curve Sources: PV module prices from Margolis (2002) and EIA (2008). Module installations from Margolis, NREL (2006) and Solarbuzz (2008, 2009)
Question 1: How does differing willingness to pay in sub-markets for technology affect appropriate subsidy? Question 2: How do national vs. international diffusion differ? Question 3: How does tapering frequency of subsidy affect public investment? Research goal – use experience curves to inform energy subsidy policy Preliminary results
Question 1: Cascading diffusion of energy technology Experience curve for reduction in production costs Public subsidy to stimulate diffusion Cost of Production A B Willingness to pay in different sub-markets Cumulative production of technology
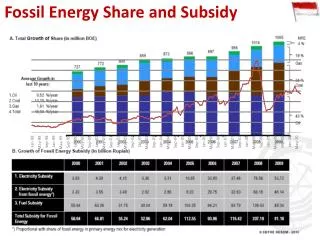
$ per Thousand Cubic Feet Source: Energy Information Admin Geographic variability in natural gas prices
Source: Energy Information Admin U.S. Climate Zones
Globalized production/trade implies cost reductions achieved in country A apply (to a large degree) to country B. Given that energy prices are higher in some countries, international diffusion paths could be much more favorable than national ones. Question 2: National versus international diffusion
Building a model • Willingness to pay in sub-markets: construct based on geographic variability in climate and energy prices. • Experience curve: base on retrospective market data, with optimistic and pessimistic cases. • Uncertainty: Future costs and willingness to pay are uncertain forecasts. Treat critical parameters as ranges.
Case study: micro-Solid Oxide Fuel Cells (SOFC) for residences • Combined Heating and Power (CHP) uses heat normally wasted • SOFC are promising CHP: scalable, efficient (40-50% to electricity, zero water demand, quiet, low emissions) and technology improving rapidly • Currently expensive, ~$20-30/W for residential system • Construct U.S. (50 states) and international diffusion paths.
Fuel cell is sized at 1 kW, providing full electricity demand for most hours of the day, but not peak. Electricity efficiency = 45%, Heat efficiency = 45% Electricity from the grid is imported as needed. Natural gas furnace supplements heat from SOFC as needed Full-on mode: runs 24 hours a day, selling electricity to grid as needed Used Equest energy modeling to determine energy/electricity flows using local climates System analyzed
Willingness to Pay • Our definition of Willingness to Pay (WTP): WTP = Maximum $ Investment to get 5 year payback time with discount rate = 10% • Optimistic (pessimistic) gas and electricity prices: most (least) favorable year from 2005-2009 • Treating only “direct economic” part of purchasing decision, i.e. no perceptions of risk, environmental benefits, etc
Experience curve • Cost = Cincompressible + (Cinitital – Cincompressible )(Cum. production)α • Initial price and production data from Australian manufacturer, gave price range. • Lack of data on learning rate, found range based on similar technologies • Use scenario approach bounding curve – optimistic: Cinitital= $20,000, LR = 25% pessimistic: : Cinitital = $37,000, LR = 15% • Incompressible cost = $800 (Braun 2010)
Discussion • Uncertainty in learning rate can flip SOFC from a prime candidate for subsidy to terrible one. • Two policy options: • Serious study of technology scale-up • Provisional subsidy, measure LR through experience • International cooperation on technology subsidies?
exwgis@rit.edu Thank you for your attention! This research was supported by the National Science Foundation, Environmental Sustainability Program Letchworth State Park, near Rochester, New York