Download
1 / 28
280 likes | 413 Views
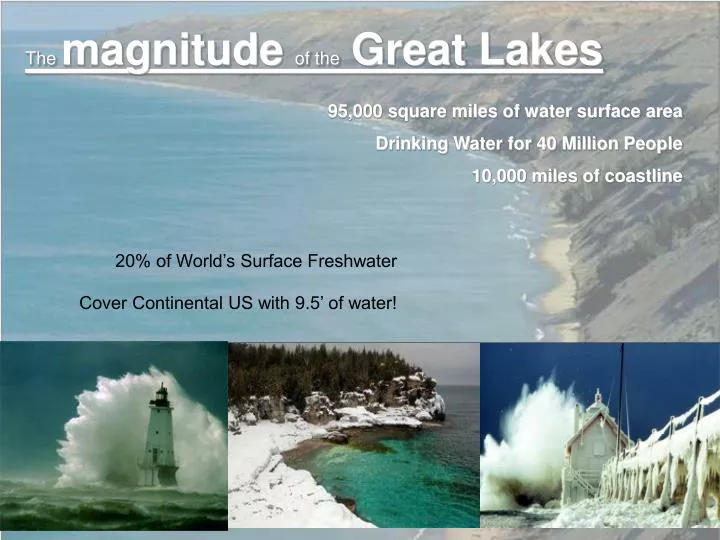
The magnitude of the Great Lakes. 95,000 square miles of water surface area Drinking Water for 40 Million People 10,000 miles of coastline. 20% of World’s Surface Freshwater. Cover Continental US with 9.5’ of water!. Lake Superior. 150 m. 60 m. Lake Huron. 85 m. Lake Michigan.

E N D
The magnitudeof theGreat Lakes 95,000 square miles of water surface area Drinking Water for 40 Million People 10,000 miles of coastline 20% of World’s Surface Freshwater Cover Continental US with 9.5’ of water!
Lake Superior 150 m 60 m Lake Huron 85 m Lake Michigan Lake Ontario 86 m Mean Depths Lake Erie 19 m
HOW DO GREAT LAKES COMPARE ON GLOBAL BASIS?? 3 of the largest freshwater lakes #1 SA #3 in Volume #3 SA #6 Volume #4 SA #5 Volume #12 SA #11 Volume #9 SA #16 Volume
LAKE MICHIGAN UNDER SIEGE: DREISSENID MUSSELS FLEXING THEIR MUSCLES The ‘New’ Lower Food-web COLLABORATORS: Steve Pothoven- NOAA Tom Nalepa- NOAA Hank Vanderploeg-NOAA Mike McCormick-NOAA Don Scavia- UM * *
TAKE HOME MESSAGE • Accidental oligotrophication of Great Lakes • Historic changes in lower food-web and water column properties. Lake Michigan (and Lake Huron) now looks like Lake Superior and clearest it has been in since white man arrived. • Principal cause of these changes are filtering activities of Dreissenid mussels-(Quagga) Benthification of Lake Michigan Food-Web Most planktonic carbon ending up in mussels on bottom that is not readily consumed by fish
Dreissenid Mussels– The principle cause of changes in native food-web Quagga Zebra
BOTTOM OF LAKE MICHIGAN (east coast) POST 30m POST 40m PRE DREISSENIDS QUAGGA MUSSELS AT 110 M
Zebra Mussel Quagga Mussel D. rostriformis bugensis D. polymorpha Intake Siphon • Competitive Advantages • Cold water adapted • Ability to live on soft substrates >900 Trillion Dreissenids in Lake Michigan (99% Quaggas)
Annual Temperature Cycle in Lake Michigan (no ice-monomictic) WINTER/SPRING FALL SUMMER Mixing Late stratification Mid Stratification Jan. 1- end May Early June-mid Sept. Mid Sept.- Jan. 1
IMPORTANT NATIVE GROUPS Phytoplankton 0.001- 0.1 mm (floating algae) Diatoms ZOOPLANKTON 1mm (planktonic invertebrates) Copepods Cladocerans Daphnia Benthic Invertebrates 10mm Historically major fish food Mysis relicta Oppossum shrimp Diporeia Amphipod, scud
Pelagic Primary Productivity Trends (mgC/m2/d) Tremendous decrease in spring 2007/08 (70%) Annual decrease ca. 30% More similar to Lake Superior- 200-400 mg/m2/d
Phytoplankton biomass measured as chlorophyll a Large decrease in spring isothermal period 2007/08 (66%)
Phytoplankton Compositional Changes in 2007/08 Spring Diatoms Spring diatoms decreased significantly–especially large net diatoms Spring BGs Cyanobacteria (BGs) did not decrease (only group) Low absolute abundance in 1980s and 1990s but now similar to diatoms
WHY LARGE CHANGES IN 2007/08? Large Populations of Dreissenid mussels became established after 1983/87 and 1995/98 samplings
Only time of year Dreissenid filtering is linked to entire water column (monomictic period) WHY BIG CHANGES IN SPRING?? . . Isothermal mixing
LESS PHYTOPLANKTON - LARGE INCREASE IN WATER CLARITY In 2010 Secchi disk transparency as high as 32 m off Frankfort
Lake Michigan Seasonal Si Utilization(Indicator of Diatom Production) Spring Drawdown Summer Closed symbols, northern basin Open symbols, southern basin EPA_GLNPO data
MI/HU Silica Drawdown Becoming likeLake Superior Michigan Huron Superior Closed symbols, northern basin Open symbols, southern basin EPA_GLNPO data
IMPORTANT NATIVE GROUPS Diatoms Phytoplankton 0.001- 0.1 mm (floating algae) ZOOPLANKTON 1mm (planktonic invertebrates) Copepods Cladocerans Daphnia Benthic Invertebrates 10mm Historically major fish food Mysis relicta Oppossum shrimp Diporeia Amphipod, scud
Total zooplankton: 2007 and 2008 very low Most of total zooplankton biomass consists of calanoid copepods in 2007 and 2009! Similar to Lake Superior in abundance and composition
Native Zooplankton Declines-food availability and predation Less food available (phytoplankton) – linked to Dreissenid mussels (after 2004/05) Increased invertebrate predation: Bythotrephes and mussel predation (resting eggs)
IMPORTANT NATIVE GROUPS Phytoplankton 0.001- 0.1 mm (floating algae) Diatoms ZOOPLANKTON 1mm (planktonic invertebrates) Cladocerans Daphnia Copepods Benthic Invertebrates Historically major fish food Mysis relicta Oppossum shrimp Diporeia Amphipod, scud
Benthic food-web shift Wet Weight Biomass in Lake Michigan (g m-2) 423 g is shell The Problem With Shells: 1) No nutritional value to fish 2) Energetic cost for fish to handle and pass 3) Energetic cost for mussel to produce Bottom Line: Mussels are an energy sink
Historic Changes to Lower Food-Web • Phytoplankton-70% decrease in spring (diatom), 30% annual decrease • Zooplankton- 2 out of 3 dominant groups decrease abundance • Benthic Invertebrate- Diporeia decline (94%) Mysis decline(50%) • Exceptionally clear water and low phosphorus offshore • Dreissena mussels populations exploding (dominant invertebrate biomass in lake) • Invasive invertebrate predators abundant
TAKE HOME MESSAGE • Accidental oligotrophication of Great Lakes • Historic changes in lower food-web and water column. Lake Michigan (and Lake Huron) now looks like Lake Superior and probably clearest it has been since white man arrived. • Principal cause of these changes are filtering activities of Dreissenid mussels-(Quagga) Benthification of Lake Michigan Food-Web Most planktonic carbon ending up in mussels on bottom that is not readily consumed by fish
Management in Post-Dreissenid Period • Oligotrophication of Lake Michigan and Great Lakes • -Meet IJC target P loads and concentrations (50%) • -Offshore region of Lake Michigan now like Lake Superior 2. New Nearshore Problems- Large mussels populations nuisance algae NEW SPATIAL AND TEMPORAL MANAGEMENT GOALS 3. Collapse and impairment of key commercial and recreational fisheries ?