Download
1 / 50
520 likes | 927 Views
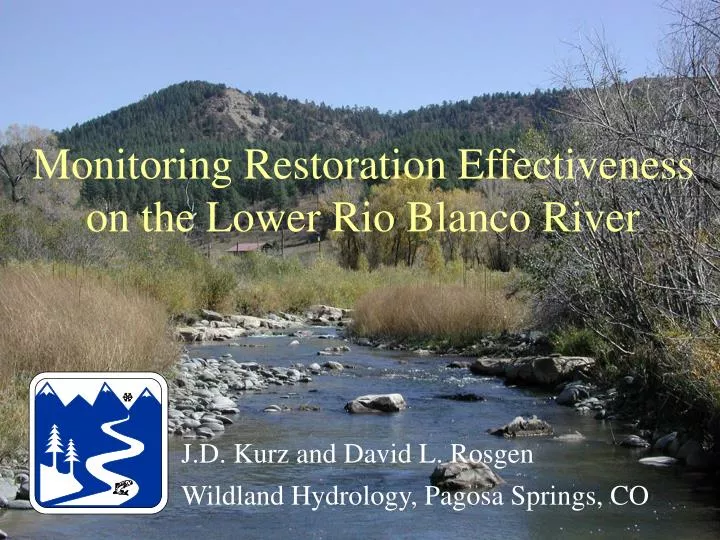
Monitoring Restoration Effectiveness on the Lower Rio Blanco River. Wildland Hydrology, Pagosa Springs, CO. J.D. Kurz and David L. Rosgen. Lower Rio Blanco River near Pagosa Springs, Colorado. Rio Blanco River. Southwestern Colorado south of Pagosa Springs. Drainage Area: 170mi 2 .

E N D
Monitoring Restoration Effectiveness on the Lower Rio Blanco River Wildland Hydrology, Pagosa Springs, CO J.D. Kurz and David L. Rosgen
Rio Blanco River • Southwestern Colorado south of Pagosa Springs. • Drainage Area: 170mi2. • Tributary to the San Juan River. • U.S. Bureau of Reclamation has operated a major trans-basin diversion since 1971. • Approximately 70 % of annual water yield transmitted to Rio Grande Basin.
Hydrology of the Rio Blanco River • Diversion has decreased the magnitude and duration and altered the timing of the bankfull discharge. • Pre-diversion bankfull discharge: 726 cfs (1.5 year flow). • Post-diversion bankfull discharge: 463 cfs (new 1.5 year flow, a 36% reduction). • Flood water usually bypassed by diversion – August 24, 1992: 3120 cfs.
Typical photograph showing the wide, shallow channel at low flow prior to restoration
Consequences of Flow Depletion Channel Stability • Wide, shallow stream lacking the shear stress necessary route sediment supplied from unregulated tributaries. • Aggradation and lateral migration. • Increased flood stage.
Consequences of Flow Depletion Water Quality • Higher water temperatures and lower dissolved oxygen during summer low flow. • Poorly defined thalweg lacking the depth necessary to create good instream habitat for trout. • Accumulation of fine sediment in spawning gravels during low flow. Aquatic Habitat
Restoration • A collective effort by Rio Blanco Homeowners Association, Colorado Water Conservation Board, and several federal agencies. • Section 319 of the Clean Water Act (EPA) provided partial funding (Hydrologic Modification is recognized as non-point source pollution in CO). • A 1.1 mile demonstration reach was restored in the fall of 1999.
Project End Project Start Location of the Demonstration Reach
Restoration Objectives Construct a channel to match the altered flow regime in order to restore the physical and biological function of the river. • Improve sediment transport and flood capacity. • Reduce bank erosion. • Raise water table during low flow. • Decrease water temperature. • Increase dissolved oxygen. • Improve fish habitat. • Improve spawning gravel. • Improve aesthetics.
Restoration Design • Create a small, low width/depth ratio channel within the over-wide C3 and F3 stream types. • Use material excavated from the low flow channel to construct floodplains and point bars. • Use large boulders to construct J-Hook Vanes and Cross Vanes.
Restoration Design – Typical Cross Section Fill F Cut
Constructed Point Bar Channel Construction
Constructed Point Bar J-Hook Vanes Reduce bank erosion and maintain deep pools downstream of each structure.
Constructed Floodplain Cross Vanes Provide grade control, reduce bank erosion, and maintain deep pools downstream of each structure.
Cross Vanes Provide bridge protection.
Monitoring Restoration Effectiveness • Permanent cross sections were installed following construction to monitor channel change. • A longitudinal profile was surveyed through the entire project length. • Resurveyed following the 2001 spring runoff , which provided excellent test of the restoration stability (1040 cfs).
Longitudinal Profile through Cross Sections 40+00, 42+00, and 44+00
Summary of Changes in Bankfull Area of 9 Cross Sections Above the Line = Increase in 2001 Below the Line = Decrease in 2001
Summary of Changes in Bankfull Width of 9 Cross Sections Above the Line = Increase in 2001 Below the Line = Decrease in 2001
Summary of Changes in Bankfull Mean Depth of 9 Cross Sections Above the Line = Increase in 2001 Below the Line = Decrease in 2001
Summary of Changes in Bankfull Width/Depth Ratio of 9 Cross Sections Above the Line = Increase in 2001 Below the Line = Decrease in 2001
Summary of Changes in Bankfull Bankfull Max Depth of 9 Cross Sections Above the Line = Increase in 2001 Below the Line = Decrease in 2001
Division of Wildlife Cross Sections (Surveyed Prior to Construction) *Average values from 5 cross sections at 33 cfs
Even with 33 percent less flow, the mean depths of the 2001 cross sections are greater than the average mean depth of 5 Division of Wildlife pre-restoration cross sections.
Even with 33 percent less flow, the max depths of the 2001 cross sections are greater than the average max of 5 Division of Wildlife pre-restoration cross sections.
Longitudinal Profile Permanent Stationing Points (Every 200 feet) Depth Increase Depth Decrease
Elevation (ft) Distance from Left Endpoint Elevation (ft) Distance from Left Endpoint 0 Comparing Velocity Distribution at 2 Cross Sections Unrestored Cross Section on an Outside Bend Restored Cross Section with J-Hook Velocity (ft/s)
Below the Restored Reach: Poorly Formed Thalweg (0.5 feet deep at 18 cfs).