Download
1 / 12
120 likes | 182 Views
Probability and Punnett Squares. Tossing Coins.

E N D
Tossing Coins • If you toss a coin, what is the probability of getting heads? Tails? If you toss a coin 10 times, how many heads and how many tails would you expect to get? Working with a partner, have one person toss a coin ten times while the other person tallies the results on a sheet of paper. Then, switch tasks to produce a separate tally of the second set of 10 tosses.
Tossing Coins (continued) • 1. Assuming that you expect 5 heads and 5 tails in 10 tosses, how do the results of your tosses compare? How about the results of your partner’s tosses? How close was each set of results to what was expected? • 2. Add your results to those of your partner to produce a total of 20 tosses. Assuming that you expect 10 heads and 10 tails in 20 tosses, how close are these results to what was expected? • 3. If you compiled the results for the whole class, what results would you expect? • 4. How do the expected results differ from the observed results?
Probability • Likelihood that a particular event will occur is called probability • Ex. Coin tossing – probability that a coin will land heads up is 1 chance in 2 tries = ½ or 50% chance • Toss the coin 3 times, probability of each coin landing heads up is ½ for each of the three tosses: ½ x ½ x ½ = 1/8 (flip 1) (flip 2) (flip 3) = 1/8 1/8 chance of flipping heads 3 times in row
Probability (continued) • Past outcomes do not affect future ones. Alleles separate completely random, like a coin flip. The Principles of Probability can be used to predict the outcomes of genetic crosses.
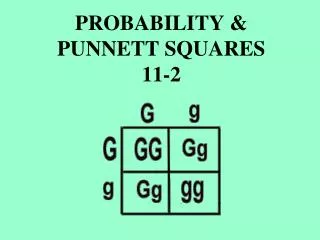
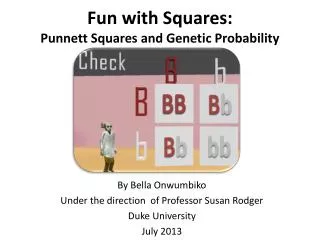
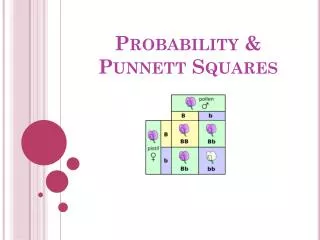
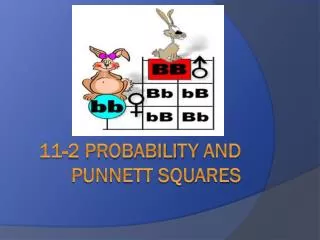
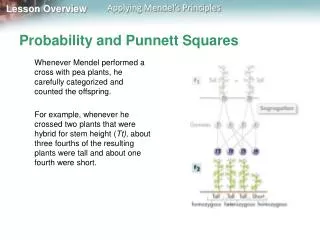
Punnett Squares • Gene combinations that might result from a genetic cross can be determined by diagrams called Punnett Squares. Parents’ alleles are placed along the top and sides of the squares while the offsprings’ alleles are inside the squares. Capital letters = dominant allele while lowercase letters = recessive alleles
Punnett Squares “T” = tall plant “t” = short plant
Punnett Squares “T” = tall plant “t” = short plant
Punnett Squares (continued) • Two identical alleles for a trait (TT or tt) = homozygous (true-breeding) • Two different alleles for a trait (Tt) = heterozygous (hybrids) • Phenotype = physical, observable characteristics • Genotype = genetic make-up, NOT observable
Probability and Segregation “T” = tall plant “t” = short plant • Genotype Ratio: 1 TT : 2 Tt : 1 tt • 1/4th of F2 plants have TT • ½ of F2 plants have Tt • 1/4th of F2 plants have tt • Phenotype Ratio: 3 Tall : 1 Short • 3 Tall plants (1 TT, 2 Tt) for every 1 short plant (1 tt) • Ratio of 3 : 1 for tall to short plants
Probabilities Predict Averages • Probability cannot predict precise outcomes, but is usually close • The larger the sample size of offspring, the closer the observed data will be to the expected data
Setting Up Punnett Squares Cross a Homozygous Yellow Seed Plant ( YY) with a Heterozygous Yellow Seed Plant (Yy) YY x Yy Genotype Ratio: 2 YY : 2 Yy Reduces to 1 YY : 1 Yy Y = yellow seed y = green seed Y Y Y Y Y Y Y yellow yellow Phenotype Ratio: All yellow seeds 100 % yellow seeds y Y Y y y yellow yellow