Download
1 / 29
300 likes | 455 Views
The Stress-Velocity Relationship for Shock & Vibration. By Tom Irvine. Introduction. The purpose of this presentation is to give an overview of the velocity-stress relationship metric for structural dynamics Build upon the work of Hunt, Crandall, Chalmers, Gaberson, Bateman et al.

E N D
The Stress-Velocity Relationship for Shock & Vibration By Tom Irvine
Introduction • The purpose of this presentation is to give an overview of the velocity-stress relationship metric for structural dynamics • Build upon the work of Hunt, Crandall, Chalmers, Gaberson, Bateman et al. • But mostly Gaberson!
Project Goals Develop a method for . . . paperppppppssss • Predicting whether an electronic component will fail due to vibration fatigue during a test or field service
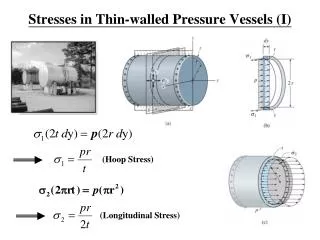
Infinite Rod, Longitudinal Stress-Velocity for Traveling Wave Compression zone Rarefaction zone Direction of travel The stress is proportional to the velocity as follows is the mass density, c is the speed of sound in the material, v is the particle velocity at a given point The velocity depends on natural frequency, but the stress-velocity relationship does not.
Finite Rod, Longitudinal Stress-Velocity for Traveling or Standing Wave Direction of travel • Same formula for all common boundary conditions • Maximum stress and maximum velocity may occur at different locations • Assume stress is due to first mode response only • Response may be due to initial conditions, applied force, or base excitation
Beam Bending, Stress-Velocity E Elastic modulus A Mass per volume I Area moment of inertia Again, • Same formula for all common boundary conditions • Maximum stress and maximum velocity may occur at different locations • Assume stress is due to first mode response only • Response may be due to initial conditions, applied force, or base excitation
Bateman’s Formula for Stress-Velocity where is a constant of proportionality dependent upon the geometry of the structure, often assumed for complex equipment to be To do list: come up with case histories for further investigation & verification
MIL-STD-810E, Shock Velocity Criterion • An empirical rule-of-thumb in MIL-STD-810E states that a shock response spectrum is considered severe only if one of its components exceeds the level • Threshold = [ 0.8 (G/Hz) * Natural Frequency (Hz) ] • For example, the severity threshold at 100 Hz would be 80 G • This rule is effectively a velocity criterion • MIL-STD-810E states that it is based on unpublished observations that military-quality equipment does not tend to exhibit shock failures below a shock response spectrum velocity of 100 inches/sec (254 cm/sec) • Equation actually corresponds to 50 inches/sec. It thus has a built-in 6 dB margin of conservatism • Note that this rule was not included in MIL-STD-810F or G, however
V-band/Bolt-Cutter Shock The time history was measured during a shroud separation test for a suborbital launch vehicle.
Space Shuttle Solid Rocket Booster Water Impact The data is from the STS-6 mission. Some high-frequency noise was filtered from the data.
SR-19 Solid Rocket Motor Ignition The combustion cavity has a pressure oscillation at 650 Hz.
RV Separation, Linear Shaped Charge The time history is a near-field, pyrotechnic shock measured in-flight on an unnamed rocket vehicle.
El Centro (Imperial Valley) Earthquake The magnitude was 7.1.
Maximum Velocity & Dynamic Range of Shock Events But also need to know natural frequency for comparison.
Project Goals Develop a method for . . . • Predicting whether an electronic component will fail due to vibration fatigue during a test or field service
Project Goals Develop a method for . . . • Predicting whether an electronic component will fail due to vibration fatigue during a test or field service
Project Goals Develop a method for . . . • Predicting whether an electronic component will fail due to vibration fatigue during a test or field service
Project Goals PUT IN YOUR OWN BEAM BENDING EXAMPLE • Predicting whether an electronic component will fail due to vibration fatigue during a test or field service
Advantages • Global maximum stress can be calculated to a first approximation with a course-mesh finite element model
Areas for Further Development of Velocity-Stress Relationship • Only gives global maximum stress • Cannot predict local stress at an arbitrary point • Does not immediately account for stress concentration factors • Essentially limited to fundamental mode response only • Great for simple structures but may be difficult to apply for complex structure such as satellite-payload with appendages • Unclear whether it can account for von Mises stress, maximum principal stress and other stress-strain theory metrics
Related software & tutorials may be freely downloaded from http://vibrationdata.wordpress.com/ The tutorial paper include derivations. • Or via Email request tom@vibrationdata.com tirvine@dynamic-concepts.com
Conclusions • Stress-velocity relationship is useful, but further development is needed including case histories, application guidelines, etc. • Dynamic stress is still best determined from dynamic strain • This is especially true if the response is multi-modal and if the spatial distribution is needed • The velocity SRS has merit for characterizing damage potential • Tripartite SRS format is excellent because it shows all three amplitude metrics on one plot