Download
1 / 23
240 likes | 380 Views
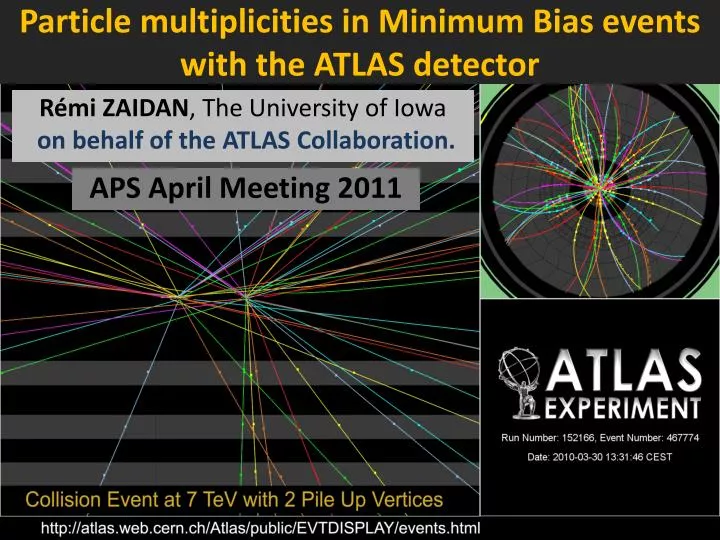
Particle multiplicities in Minimum Bias events with the ATLAS detector. APS April Meeting 2011. Rémi ZAIDAN , The University of Iowa on behalf of the ATLAS Collaboration. Measurements and Motivations. Measurements made by the ATLAS detector :

E N D
Particle multiplicities in Minimum Bias events with the ATLAS detector APS April Meeting 2011 Rémi ZAIDAN, The University of Iowa on behalf of the ATLAS Collaboration.
Measurements and Motivations • Measurements made by the ATLAS detector: • Charged particle multiplicity,it’s dependence on pT and h and it’s correlation with pT. • Physics motivation: improve the understanding of non-perturbative QCD. • by studying the properties of inelastic proton-proton collisions. • Experimental motivation: model the pileup and underlying events. • Necessary for measuring physics processes at high energies. • For the first time modeling of our detector is confronted to reality. Remi ZAIDAN - APS April Meeting 2011
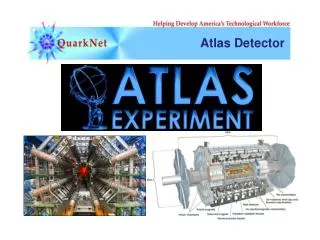
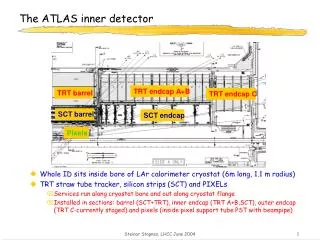
ATLAS detector overview • Minimum Bias Trigger Scintillators: • 2 wheels at ±3.6 m: • 8 cells: 2.12 < |η| < 2.83 • 8 cells: 2.83 < |η| < 3.8 Remi ZAIDAN - APS April Meeting 2011 • Pixels Detector: |h|<2.5 • 3 barrel layers, 3 end-cap disks. • σrϕ ∼10 μm ; σz ∼ 115 μm • Silicon Strip Detector (SCT): |h|<2.5 • 4 barrel layers, 9 end-cap disks. • σrϕ ∼17 μm ; σz ∼ 580 μm • Transition Radiation Tracker (TRT): |h|<2.1 • ~ 32 quasi-continuous hits per track. • σr ∼130 μm
Overview of the analysis Remi ZAIDAN - APS April Meeting 2011 • Data samples: • 0.9 TeV: ~0.35 M events, ~4.5 M tracks (~7 mb-1). • 2.36 TeV: ~6 K events, ~ 40 K tracks (~0.1 mb-1). • The SCT detector was not at it’s nominal operation mode: • Large systematics on pT measurements. • Cannot go below pT = 500 MeV: particles need to cross the TRT because the pixel detector by itself does not provide a reliable pT measurement. • 7 TeV: ~10 M events, ~210 M tracks (~190 mb-1).
Overview of the analysis *A primary particle is a direct product of hadronization or the product of a primary particle whose lifetime is t < 10-11 s • Analysis strategy: • All results are presented at hadron level without correcting for diffractive components (details in backup slide): • an iterative Bayesian procedure is used to correct charged particle multiplicity. • Trigger: single arm minimum bias trigger. • Event selection: vertex + ≥ 2 tracks • Track selection: apply various quality cuts and remove non-primary* tracks by cutting on impact parameter at the primary vertex. • Phase-space: pT > 100 MeV ; |h| < 2.5 ; nch ≥ 2. (pT > 500 MeV for 2.36 TeV) Remi ZAIDAN - APS April Meeting 2011
Track ReconstructionValidation Remi ZAIDAN - APS April Meeting 2011 Basic track quantities show good agreement between data and Monte Carlo: Several corrections are applied to the Monte Carlo plots to take into account beam spot effects, disabled detector elements and differences in the pT spectrum.
Track reconstruction Remi ZAIDAN - APS April Meeting 2011 • Tracking efficiency is determined from MC: • MC is validated against data. • parameterized as function of pT and h. • Main systematic uncertainties are due to the material mis-modeling in the MC. This was done using two complementary methods: • Look at bias in reconstructed K0 mass due to energy loss (sensitive to radiation length). • Look at the fraction of tracks in the pixel detector that are matched to a track in the full inner detector (sensitive to interaction length). • Rate of non primary tracks is estimated from data: • by fitting the tails of the impact parameter distributions.
Results: nch distribution Remi ZAIDAN - APS April Meeting 2011 Predictions for various models differ between each other, and do not agree well with the data. At low nch, this is partially explained by the fact that the diffractive components play an important role in this region.
Results: dNch/dh Remi ZAIDAN - APS April Meeting 2011 The shape of the h distribution is well described by the different Models. Discrepancies can be seen in the normalization.
Results: 1/2πpT · 1/Nev · d2Nch/dηdpT Remi ZAIDAN - APS April Meeting 2011 Measurements span 12 orders of magnitude. Model predictions agree better with data at intermediate momenta (0.5 to 3 GeV). Large differences between measurements and predictions are seen at low and high pT.
Results: <pT> vs. nch Remi ZAIDAN - APS April Meeting 2011 Predictions for various models differ significantly between each other especially at high nch.
Comparison with other experiments Remi ZAIDAN - APS April Meeting 2011 • Results from the various experiments agree rather well: • ALICE sees slightly less tracks at central pseudo-rapidity than ATLAS and CMS. • Still agree within 1 sigma of the total uncertainty.
Conclusion Remi ZAIDAN - APS April Meeting 2011 • Presented charged particle multiplicity measurements with the ATLAS detector at √s = 0.9 TeV, √s = 2.36 TeV and √s = 7 TeV. • The charged particle multiplicity per unit of pseudo-rapidity at h=0 and pT>100 MeV was measured to be: • 5.635 ± 0.002 (stat.) ± 0.149 (syst.) at √s = 7 TeV. • 3.486 ± 0.001 (stat.) ± 0.077 (syst.) at √s = 0.9 TeV. • The difference between models are larger at high √s for pT > 100 MeV. • The measured charged particle density is higher than model predictions.
Back up slides Remi ZAIDAN - APS April Meeting 2011
The Minimum Bias Trigger Minimum Bias Trigger Scintillators Inner Detector • The trigger efficiency is parameterized as function of : the number of selected tracks where the tracks were extrapolated to the beam spot instead of the primary vertex in the absence of the vertex Events are triggered with at least one hit on either sides of the MBTS scintillators. Efficiency measured on data with respect to a random trigger with a requirement on the minimal activity in the inner detector (Space Points trigger). Efficiency was checked to be flat in pT and h. Remi ZAIDAN - APS April Meeting 2011
Vertex requirement Dz0 Remi ZAIDAN - APS April Meeting 2011 • Tracks used to reconstruct the primary vertex are selected with slightly tighter cuts than the analysis tracks. • The vertex efficiency is measured from data. • It is parameterized as function of the number of selected tracks. • The dependencies on the longitudinal impact parameter spread (Dz0) and pT for events with low track multiplicity are also taken into account. • Pileup events removed: • veto events with a 2nd vertex with ≥ 4 tracks • Data was taken when pileup rate was ~ 0.1%
Pileup removal Remi ZAIDAN - APS April Meeting 2011 • The fraction of events with more than one p-p interaction is estimated to be around 0.1% for the data collected at 7 TeV. • The presence of such events might bias the tails on the nch distribution. • Expect ~1% of events with a second reconstructed vertex: • mostly fakes and secondary vertices with few tracks. • Remove events with a second vertex with more than 3 tracks. • Residual effects after pileup removal: • Fake pileup events removed: 0.03% • True pileup events not removed : 0.01% • True Pileup events reconstructed as single vertex: 0.01%
Track selection cuts • Phase space: • pT > 100 MeV ; |h| < 2.5 • Tight impact parameter: • |d0| < 1.5 mm ; |z0sin(q)|<1.5 mm • whenever needed for events with no vertex, extrapolate tracks to beam spot and cut on transverse impact parameter: |d0BS| < 1.5 mm • B-Layer hit: • Only if expected (track doesn’t extrapolate to dead detector element). • Require 1 pixel hit if no B-Layer hit is expected. • SCT hit requirements: • 100 < pT < 200 MeV: 2 SCT hits • 200 < pT < 300 MeV: 4 SCT hits • pT > 300 MeV: 6 SCT hits • Track fit probability: • pT > 10 GeV : prob(c2,ndof) > 0.01 Remi ZAIDAN - APS April Meeting 2011
Non primary tracks Remi ZAIDAN - APS April Meeting 2011 • The rate of non-primary tracks is estimated by fitting the tails of the transverse impact parameter distribution on data: • Contribution from conversion electrons and other types of non-primaries are fitted simultaneously. • Results validated by fitting the longitudinal impact parameter as electrons from conversion look identical to other type of non-primary tracks.
High pT tracks Remi ZAIDAN - APS April Meeting 2011 • Large fractions of tracks at high pT are badly measured due to conspiracy of multiple effects: • Large extrapolation at high h between Pixel and SCT detectors. • Hadronic interactions between Pixel and SCT detectors causing the tracks to “kink” in the opposite direction of their curvature. • Rapidly falling pT spectrum such that a small migration from low pT become significant at high pT. • Remove those tracks by cutting on the c2 probability of the track fit for pT > 10 GeV.
Correction Procedure • All results are corrected back to the hadron level: • No attempt to subtract diffractive components. • Event level correction for vertex and trigger efficiencies: • Track level correction for tracking efficiency, non-primary tracks and tracks from outside of the kinematic range: • Unfolding of the charged particle multiplicity distribution using a recursive Bayesian approach (a similar approach is used to correct for pT resolution): • Correct analytically for events lost in the nsel=0,1 bins: Remi ZAIDAN - APS April Meeting 2011
Monte Carlo Models *AMBT1: New tune giving a high weight to the recent ATLAS results with pT > 500 MeV and nch ≥ 6. Remi ZAIDAN - APS April Meeting 2011
References Remi ZAIDAN - APS April Meeting 2011 • ATLAS latest paper on minimum bias measurements at 0.9, 2.36 and 7 TeV: • arXiv:1012.5104v1 [hep-ex] • ATLAS conference notes with more details and preliminary results: • 0.9 and 7 TeV: ATLAS-CONF-2010-046 • 2.36 TeV: ATLAS-CONF-2010-047 • Minimum bias comparison plots between LHC experiments: • http://lpcc.web.cern.ch/LPCC/index.php?page=mb_ue_wg_docs • Monte Carlo Tunes: • MC09 : PHYS-PUB-2010-002 • AMBT1: ATLAS-CONF-2010-031 • ATLAS detector description: • The ATLAS Collaboration, The ATLAS Experiment at the CERN Large Hadron Collider, JINST 3 (2008) S08003