Download
1 / 18
180 likes | 185 Views
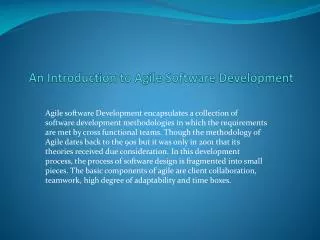
Information Visualization as an aid to Agile Software Development. By: Andrew J. Armstrong. Agile Software Development Overview [4]. Manifesto Individuals and interactions over processes and tools Working software over comprehensive documentation

E N D
Information Visualizationas an aid toAgile Software Development By: Andrew J. Armstrong
Agile Software Development Overview[4] • Manifesto • Individuals and interactions over processes and tools • Working software over comprehensive documentation • Customer collaboration over contract negotiation • Responding to change over following a plan
Agile Software Development Overview cont. http://images.vertex42.com/ExcelTemplates/excel-gantt-chart-MF_large.gif http://cdn.ttgtmedia.com/WhatIs/images/pert_chart.jpg
Paper Overview • “Information Visualization for Agile Software Development Teams” • By: Julia Paredes, Craig Anslow & Frank Maurer Research Questions • What information visualization techniques are used in Agile Software Development? • What information visualization techniques raise awareness of artifacts in Agile software development teams?
Information Visualization • Information Visualization – “Use of visual representations of abstract data to amplify cognition.”[1] • Effective visualizations should: • Quickly identify relevant information • Understand the relationships between elements of the visualization • “Make the structure, behavior and evolution of software, such as code organization, software state and bugs, more understandable.”[1]
Information Visualization - Design • Low Fidelity Sketches • Input Diagrams • Both typically used to make design decision & communicate information.
Information Visualization – Design cont. • Formal Diagrams • Example UML • Explain & Share Information • Empirical Study • 35 / 50 Developers did not use UML • Others only used in very early stages http://www.uml-diagrams.org/examples/class-diagram-example-hasp-licensing-domain.png
Design - Example Software • Microsoft SketchFlow • ActiveStory • Low Fidelity Sketches • Easy to produce/edit • Support gesture/touch http://blogs.msdn.com/cfs-filesystemfile.ashx/__key/communityserver-blogs-components-weblogfiles/00-00-01-06-46-metablogapi/7041.donate_5F00_thumb_5F00_1A04D12A.png
Information Visualization - Development • Problems in source code • Areas suitable for refactoring • “restructuring the existing code without changing the external behavior” • Continuous Integration • Automated Testing • SQA Mashup
Development Software – SQA Mashup • Tool Requirements • 1) Able to located quality hot-spots in source code • 2) Permit dynamic arrangement of information shown in the UI • 3) Provide awareness of the activities of peers • 4) Discover immediately where changes occurred, when they were made & how made them • 5) Provide an interactive visualization of roles (developer vs. manager) • 6) Interoperate with other software engineering tools • 7) Permit independent development of UI
Information Visualization - Communication • Verbal vs. Non-verbal • “Big Picture” • Standard Aspects • Dashboards
Information Visualization – Progress Tracking • Burn charts • Importance of work completed • Completion definition? • Task assigning • Estimation • MSE’s https://www.atlassian.com/wac/software/jira/agile/tourBlocks/0/screenshotTourSection/01/imageBinary/jiraagile-02_whyja_1_flexibleplanning.png
Discussion & Conclusions • Design • Sketches • ActiveStory • Development • Understanding Code • Physical Objects • Communication • Information Radiators • Dashboards • Progress Tracking • Taskboards
Discussion & Conclusions cont. • Implications • Barriers to adoption of technologies
References • [1] Paredes, J.; Anslow, C.; Maurer, F., "Information Visualization for Agile Software Development," in Software Visualization (VISSOFT), 2014 Second IEEE Working Conference on , vol., no., pp.157-166, 29-30 Sept. 2014, URL: http://ieeexplore.ieee.org/stamp/stamp.jsp?tp=&arnumber=6980227&isnumber=6980193 • [2] Brandtner, M.; Giger, E.; Gall, H., "Supporting continuous integration by mashing-up software quality information," in Software Maintenance, Reengineering and Reverse Engineering (CSMR-WCRE), 2014 Software Evolution Week - IEEE Conference on , vol., no., pp.184-193, 3-6 Feb. 2014, URL: http://ieeexplore.ieee.org/stamp/stamp.jsp?tp=&arnumber=6747169&isnumber=6747152 • [3] Hosseini-Khayat, A.; Seye, T.; Burns, C.; Maurer, F., “Low-Fidelity Prototyping of Gesture-based Applications,” in 3rd ACM SIGCHI symposium on Engineering interactive computing systems , pp. 289-294, URL: http://dl.acm.org/citation.cfm?id=1996538 • [4] Martin, Robert C. & Martin, Micah, “Agile Principles, Patterns, and Practices in C#,” Chapter 1: Agile Practices • [5] http://ieeexplore.ieee.org/stamp/stamp.jsp?arnumber=6062104