Download
1 / 62
620 likes | 626 Views
This text explores the concepts of Primal-Dual PCA Analysis and SVD Decomposition in data analysis, with examples and comparisons of different approaches.

E N D
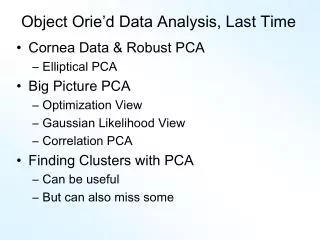
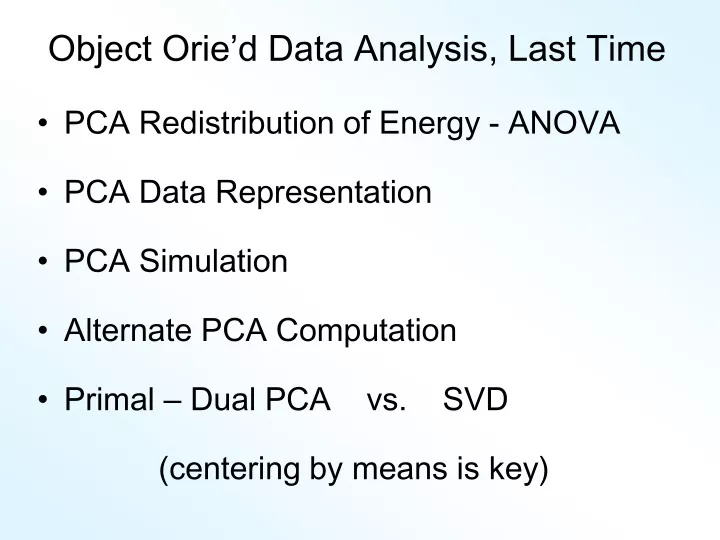
Object Orie’d Data Analysis, Last Time • PCA Redistribution of Energy - ANOVA • PCA Data Representation • PCA Simulation • Alternate PCA Computation • Primal – Dual PCA vs. SVD (centering by means is key)
Primal - Dual PCA Toy Example 1: Random Curves, all in Primal Space: * Constant Shift * Linear * Quadratic Cubic (chosen to be orthonormal) Plus (small) i.i.d. Gaussian noise d = 40, n = 20
Primal - Dual PCA Toy Example 1: Raw Data
Primal - Dual PCA Toy Example 1: Raw Data Primal (Col.) curves similar to before Data mat’x asymmetric (but same curves) Dual (Row) curves much rougher (showing Gaussian randomness) How data were generated Color map useful? (same as mesh view) See richer structure than before Is it useful?
Primal - Dual PCA Toy Example 1: Primal PCA Column Curves as Data
Primal - Dual PCA Toy Example 1: Primal PCA Expected to recover increasing poly’s But didn’t happen Although can see the poly’s (order???) Mean has quad’ic (since only n = 20???) Scores (proj’ns) very random Power Spectrum shows 4 components (not affected by subtracting Primal Mean)
Primal - Dual PCA Toy Example 1: Dual PCA Row Curves as Data
Primal - Dual PCA Toy Example 1: Dual PCA Curves all very wiggly (random noise) Mean much bigger, 54% of Total Var! Scores have strong smooth structure (reflecting ordered primal e.v.’s) (recall primal e.v. dual scores) Power Spectrum shows 3 components (Driven by subtraction Dual Mean) Primal – Dual mean difference is critical
Primal - Dual PCA Toy Example 1: Dual PCA – Scatterplot
Primal - Dual PCA Toy Example 1: Dual PCA - Scatterplot Smooth Curve Structure But not usual curves (Since 1-d curves not quite poly’s) And only in 1st 3 components Recall only 3 non-noise components Since constant curve went into mean (dual) Remainder is pure noise Suggests wrong rotation of axes???
Primal - Dual PCA A 3rd Type of Analysis: Called “SVD decomposition” Main point: subtract neither mean Viewed as a serious competitor Advantage: gives best Mean Square Approximation of Data Matrix Vs. Primal PCA: best about col. Mean Vs. Dual PCA: best about row Mean Difference in means is critical!
Primal - Dual PCA Toy Example 1: SVD – Curves view
Primal - Dual PCA Toy Example 1: SVD Curves View Col. Curves view similar to Primal PCA Row Curves quite different (from dual): Former mean, now SV1 Former PC1, now SV2 i.e. very similar shapes with shifted indices Again mean centering is crucial Main difference between PCAs and SVD
Primal - Dual PCA Toy Example 1: SVD – Mesh-Image View
Primal - Dual PCA Toy Example 1: SVD Mesh-Image View Think about decomposition into modes of variation Constant x Gaussian Linear x Gaussian Cubic by Gaussian Quadratic Shows up best in image view? Why is ordering “wrong”???
Primal - Dual PCA Toy Example 1: All Primal Why is SVD mode ordering “wrong”??? Well, not expected… Key is need orthogonality Present in space of column curves But only approximate in row Gaussians The implicit orthogonalization of SVD (both rows and columns) gave mixture of the poly’s.
Primal - Dual PCA Toy Example 2: All Primal, GS Noise Started with same column space Generated i.i.d. Gaussians for row cols Then did Graham-Schmidt Ortho-normalization (in row space) Visual impression: Amazingly similar to original data (used same seeds of random # generators)
Primal - Dual PCA Toy Example 2: Raw Data
Primal - Dual PCA Compare with Earlier Toy Example 1
Primal - Dual PCA Toy Example 2: Primal PCA Column Curves as Data Shows Explanation (of wrong components) was correct
Primal - Dual PCA Toy Example 2: Dual PCA Row Curves as Data Still have big mean But Scores look much better
Primal - Dual PCA Toy Example 2: Dual PCA – Scatterplot
Primal - Dual PCA Toy Example 2: Dual PCA - Scatterplot Now poly’s look beautifully symmetric Much like chemo spectrum examples But still only 3 Same reason, dual mean ~ primal constants Last one is pure noise
Primal - Dual PCA Toy Example 2: SVD – Matrix-Image
Primal - Dual PCA Toy Example 2: SVD - Matrix-Image Similar Good Effects Again have all 4 components So “better” to not subtract mean???
Primal - Dual PCA Toy Example 3: Random Curves, all in Dual Space: 1 * Constant Shift 2 * Linear 4 * Quadratic 8 * Cubic (chosen to be orthonormal) Plus (small) i.i.d. Gaussian noise d = 40, n = 20
Primal - Dual PCA Toy Example 3: Raw Data
Primal - Dual PCA Toy Example 3: Raw Data Similar Structure to e.g. 1 But Rows and Columns trade places And now cubics visually dominant (as expected)
Primal - Dual PCA Toy Example 3: Primal PCA Column Curves as Data Gaussian Noise Only 3 components Poly Scores (as expected)
Primal - Dual PCA Toy Example 3: Dual PCA Row Curves as Data Components as expected No Gram-Schmidt (since stronger signal)
Primal - Dual PCA Toy Example 3: SVD – Matrix-Image
Primal - Dual PCA Toy Example 4: Mystery #1
Primal - Dual PCA Toy Example 4: SVD – Curves View
Primal - Dual PCA Toy Example 4: SVD – Matrix-Image
Primal - Dual PCA Toy Example 4: Mystery #1 Structure: Primal - Dual Constant Gaussian Gaussian Linear Parabola Gaussian Gaussian Cubic Nicely revealed by Full Matrix decomposition and views
Primal - Dual PCA Toy Example 5: Mystery #2
Primal - Dual PCA Toy Example 5: SVD – Curves View
Primal - Dual PCA Toy Example 5: SVD – Matrix-Image
Primal - Dual PCA Toy Example 5: Mystery #2 Structure: Primal - Dual Constant Linear Parabola Cubic Gaussian Gaussian Gaussian Gaussian Visible via either curves, or matrices…
Primal - Dual PCA Is SVD (i.e. no mean centering) always “better”? What does “better” mean??? A definition: Provides most useful insights into data Others???
Primal - Dual PCA Toy Example where SVD is less informative: Simple Two dimensional Key is subtraction of mean is bad I.e. Mean dir’n different from PC dir’ns And Mean Less Informative
Primal - Dual PCA Toy Example where SVD is less informative: Raw Data
Primal - Dual PCA PC1 mode of variation (centered at mean): Yields useful major mode of variation
Primal - Dual PCA PC2 mode of variation (centered at mean): Informative second mode of variation
Primal - Dual PCA SV1 mode of variation (centered at 0): Unintuitive major mode of variation
Primal - Dual PCA SV2 mode of variation (centered at 0): Unintuitive second mode of variation
Primal - Dual PCA Summary of SVD: Does give a decomposition I.e. sum of two pieces is data But not good insights about data structure Since center point of analysis is far from center point of data So mean strongly influences the impression of variation Maybe better to keep these separate???
Primal - Dual PCA Bottom line on: Primal PCA vs. SVD vs. Dual PCA These are not comparable: Each has situations where it is “best” And where it is “worst” Generally should consider all And choose on basis of insights See work of Lingsong Zhang on this…
Real Data: Primal - Dual PCA Analysis by: Lingsong Zhang Zhang, L., (2006), "SVD movies and plots for Singular Value Decomposition and its Visualization", University of North Carolina at Chapel Hill, available at http://www.unc.edu/~lszhang/research/network/SVDmovie
Real Data: Primal - Dual PCA Use slides from a talk: LingsongZhangFunctionalSVD.pdf Main Points: Different approaches all can be “best” Show different aspects of data Generalized SCREE ploy “outliers” are interesting