Download
1 / 55
550 likes | 709 Views
Price Discovery, Foreign Ownership, and Rule of Law. Jun Cai, City University of Hong Kong Richard Y.K. Ho, City University of Hong Kong Robert Korajczyk, Northwestern University Zheng Zhang, Peking University. 1. Motivation.

E N D
Price Discovery, Foreign Ownership, and Rule of Law Jun Cai, City University of Hong Kong Richard Y.K. Ho, City University of Hong Kong Robert Korajczyk, Northwestern University Zheng Zhang, Peking University 1
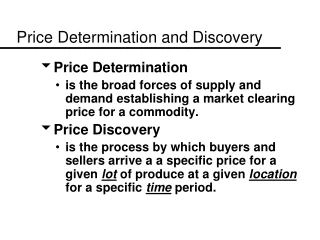
Motivation Price discovery is a process by which securities gather new information and markets attempt to find equilibrium prices (Schreiber and Schwartz, 1985) Numerous theoretical models have studied the role and discretionary behaviors of various participants such as market makers, informed investors, and uninformed investors under alternative trading mechanisms including quote- and order-driven markets (O’Hara, 1995) 2
Motivation Price discovery during the trading day, including price discovery by trade size (Barclay and Warner, 1993) and by investor types (Chakravarty, 2001) Price discovery during the pre-open and after hours period (Biais, Hillion, and Spatt, 1999; Cao, Ghysels, and Hatheway, 2000; Barclay and Hendershott, 2003) 3
Motivation Price discovery on alternative trading venues (Huang, 2002; Barclay, Hendershot, and McCormick, 2003) and exchanges in different geographic locations (Garbade and Silber ,1979; Hasbrouck, 1995; Harris et. al; 1995). 4
Motivation The relation between price discovery and a measurement of degree of openness or investor accessibility. Developed markets have captured much attention in the existing literature of price discovery. 5
Motivation Emerging markets are typically characterized by more severe barriers to investment or tighter controls on foreign capital flow, less market transparency, larger transaction costs such as bid-ask spreads, and higher return volatility. We focus on a comprehensive list of 23 emerging markets. 6
Major Findings Price discovery immediately after the market opens and before the closing is most important for the majority of the emerging markets in our sample. Price discovery is negatively related to the level of spread and positively related to the extent of analyst coverage. 7
Major Findings The presence of a large percentage of stocks held by foreign investors significantly facilitates the process of price discovery. Price Discovery is related to top5, top10, and top35 foreign investors. Price Discovery is related to foreign ownership concentration index. 8
Major Findings Rule of Law (LaPorta, 1998) also matters and facilitate price discovery. Rule of Law measure is from International Country Guide Risk. LaPorta’s data are from 1982 to 1995. We update the rule of law measure from 2001 to 2006. The results are robust to both LaPorta’s measure and our measure. 9
Major Findings Accelerated price discovery is associated with more foreign investors complements those studies on lower cost of equity and slightly decreased return volatility after capital market liberalization in emerging markets (Bekaer and Harvey, 1997, 2000) as well as the study by Choe, Kho, and Stulz (1999). 10
Major Findings The evidence on the beneficial role of foreign investors in emerging markets is important in light of the debate on whether developing countries should impose tighter control and regulation on foreign capital inflow (Stiglitz, 1998). 11
Data Standard and Poor’s Emerging Markets Database This dataset provides comprehensive accounting and market information and statistics for emerging markets Bloomberg Bloomberg’s real-time data feed data to obtain intraday trade and quote data 12
Data Osiris Ownership database Domestic ownership data FactSet Ownership database information on direct U.S. institutional ownership of local stocks The list of depositary receipts (DRs) maintained by the Bank of New York Cross-listed stocks from Factset I/B/E/S dataset 13
Sample 1,504 stocks from the 23 emerging market Argentina, Brazil, Chile, China, the Czech Republic, Egypt, Greece, Hungary, India, Indonesia, Israel, South Korea, Malaysia, Mexico, Peru, the Philippines, Poland, Russia, South Africa, Taiwan, Thailand, Turkey, and Venezuela. 14
Sample Filtering rules Infrequently traded stocks Significant portion of large percentage quoted spread Stock splits and minimum trading unit changes 15
Methodology Weight Price Contribution Measure 21
Methodology A complication in studying intraday price discovery across a large number of different exchanges is the notable difference in total trading hours. It is not feasible to directly compare WPCs for a fixed period of time such as the first 30 minutes on different exchanges 22
Methodology Total trading hours on each day is first divided into quintile intervals and the corresponding WPC is calculated for each interval. The following is Table 3. 23
Methodology Invest weight factor, or investibility index Foreign direct ownership Dummy variables that represent the simultaneous trading of Bank of New York depository receipts in major international equity markets Dummy also includes the cross-listed firms. 25
Table 4 Summary statistics Foreign ownership has a high correlation with SIZE, IWF,DR_CRO, and NOA Rule of Law and Legal Origin has a high correlation of 0.32
Table 5 Benchmark OLS regressions Domestic ownership, top3, top5, and domestic ownerhsip concentration are not significant.
Table 6 Foreign Ownership Top 5 Top 10 Top 35 Ownership Concentration Index
The story is consistent with information acquisition cost story (Boehmer and Kelley, 2009) and When there is a fixed component of information acquisition cost, investors will acquire information on large stake ownership. The evidence is not supportive of the competition story of Holden and Subrahmanyan (1992). The competition story will predict with less concentrated ownership will be more efficient. Here the concentration index has a positive sign. The evidence is supportive of Brennan and Subrahmanyam (1995) story of more analyst following stocks with high institutional ownership, which in turn facilitate price discovery.
Table 7 Rule of Law and Legal Origin Rule of Law measure fro LaPorta (1996). Measure from 1982-1995, original measured used by LaPorta Measure from 2001-2006 Legal origin, 1 = civil, 0=common
Endogeneity Issue Foreign Ownership is clearly endogenous. OLS estimates will be biased. Solution: IV estimator (via 2SLS, 3SLS) First stage, test strength of the instrument Second stage, include the instrumented FOWN in the OLS regression
Table 8 The Strength of 2SLS Instruments F-statistic > 10 is needed for the instrument to be strong. See Stock and Yogo (2001) and Stock, Wright, and Yogo, (2002)
Spread,Volatility, and Rule of Law are strong predictor of WPC Size, Invesbility, Number of analysts, and DR_CRO dummy are strong predictor of FOWN. Legal origin is also useful.
Table 9 2SLS and 3SLS
Impact of of Unobservable CV (Confounding Variable) In our case, suppose Z is define as the set of 41exogenous variables in the following way:
Impact of of Unobservable CV (Confounding Variable) where Δ is the set of parameters in Equation (3) excluding δ0 and δ10, CV denotes the confounding variable. From Table 7, the estimate for = 0.090 with a t-statistic of 3.81 for the first quintile WPC and the estimate for = -0.139 with a t-statistic of -4.45 for the last quintile WPC
Impact of of Unobservable CV (Confounding Variable) The ITCV is the minimum absolute value of the product of (i) the partial correlation between WPC and confounding variable, controlling for the other instruments (Z), rWPC∙CV|Z, and the partial correlation between FOWN and the confounding variable rFOWN∙CV|Z, that drives the t-statistic on FOWN to borderline
Impact of of Unobservable CV (Confounding Variable) Table 10 shows the value of the ITCV = rWPC∙CV|Z× rFOWN∙CV|Z for FOWN to be 0.0168 (-0.0392) for the earliest (latest) quintile in panel A (B). Any confounding variable having the product of partial correlations greater, in absolute value, than ITCV would overturn the significance of FOWN in Table 7. This implies minimum absolute partial correlations with the confounding variable of 0.119 and 0.141 for WPC and FOWN, respectively for the earliest quintile and 0.178 and 0.220 for the latest quintile, when the critical t-statistic is set to be 1.96 in absolute value (5% significance).
n Panel A of Table 10 for example, when CV is set to be spread, the partial correlation is -0.2623. When CV is set to be number of analysts, the partial correlation is 0.1844. The product of -0.2623 with 0.1844 is equal to -0.0484, larger than the threshold ITCV = 0.0168 or 0.0215 in absolute value. Therefore if we have a single variable that is as strong as spread in predicting WPC and at the same as strong as number of analysts in predicting FOWN, then the significance of from OLS applied to (3) will be overturned.