Download
1 / 65
650 likes | 804 Views
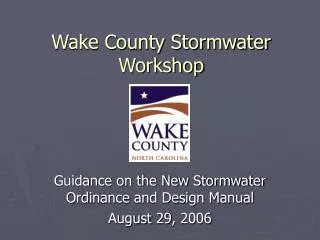
Wake County Stormwater Management Task Force Meeting #4 June 15, 2006. Stormwater Perspectives. Expected Outcome:. Task Force understanding of existing and future stormwater needs from various perspectives. Issues Module. Meeting 4 June 2006. Meeting Agenda. Dinner and Welcome

E N D
Wake CountyStormwater Management Task ForceMeeting #4June 15, 2006
Stormwater Perspectives Expected Outcome: • Task Force understanding of existing and future stormwater needs from various perspectives Issues Module Meeting 4 June 2006
Meeting Agenda • Dinner and Welcome • Kenn Gardner, Wake County • Stormwater Case Studies • 1) Flooding • 2) Stream Quality • 3) Sedimentation & Erosion Control • 4) Secondary & Cumulative Impacts
Task Force Survey ResultsTop Five Sources of Pollution in Wake County • Runoff from Parking Lots and Streets • Runoff from Construction Sites and Disturbed Land • Runoff from Residential Development • Runoff from Commercial and Industrial Development • Soil Eroding from Unstable Stream Banks Notable Mention: Runoff from Farms and Ag Ops
Breakdown of Typical Stormwater Complaints for Local Governments Percent of Total Phone Calls/Complaints
Meeting Agenda • Dinner and Welcome • Kenn Gardner, Wake County • Stormwater Case Studies • 1) Flooding • 2) Stream Quality • 3) Sedimentation & Erosion Control • 4) Secondary & Cumulative Impacts
Floodplain Mapping in Wake County Wake Forest Rd Hodges St New Bern Ave Atlantic Ave Marsh Creek
Flood Plain Development • 1992 Flood Plain Maps (Existing Conditions) • Approximate flood plain area = 50,865 acres • 2004 Flood Plain Maps (Existing Conditions) • Approximate flood plain area = 49,258 acres • 2004 Future Conditions Maps • Approximate flood plain area = 54,229 • Basis of future flood plain scenario = County-wide equivalent zoning (to be confirmed)
Impact of Map Changes on Property Results of County Study In the unincorporated county alone, 130 structures are now within the 2004 existing or future floodplain limits as compared to the 1992 maps
Streamflow Near Crabtree Valley Mall June 14, 2006 Peak Streamflow = 8,650 cfs Hurricane Floyd: Peak Streamflow = 7,080 cfs
Stream Stage Near Crabtree Valley Mall June 14, 2006 Peak Stage = 23.77 ft. Hurricane Floyd: Peak Stage = 21.5 feet
NC 55 & Holly Springs Rd. Town of Holly Springs – Case Study, August 2003 Windward Pointe Subdivision
Case Study – Structural Flooding Crabtree Valley Mall
Sears/Jiffy Lube Parking Lot 11:45 AM
Glenwood Ave. Parking Deck 11:45 AM
Project Details • Total Drainage Area = 125 acres • Replacement of 4 Driveway Culverts • Replacement of 900 feet of Storm Sewer • Total Estimated Project Cost = $2 million
Nuisance FloodingSample Article & Photo Recent N&O Article (dated June 9, 2006) Recent Homeowner Photo (May ’06) Note: Photo not related to story
Example 1: Nuisance FloodingResident Downstream of Elementary School • Backyard stream receives runoff from upstream properties (residential land use and elementary school) • Stream flow damages yard and causes potential safety issue
Relevant Data Total Drainage Area = 10.0 acres Impervious Area = 2.5 acres Durant Elementary
Property Owner CommentsExcerpt from Emails to Local Government Officials • “I have contacted XXXX, but they don't seem to be that concerned.” • “I consider this to be a grave emergency.” • “I would like for you to follow up on this matter for a quick and permanent solution.” • “I have been trying to resolve this problem for over two years”
Example 2: Nuisance FloodingResident Near Stormwater Outfall/Level Spreader • Backyard receives flooding during most rainfall events (as little as 1/3”) • Flooding damages property, cause an eye sore, potential safety hazard and impacts property value • Town will not accept stormwater system until developer addresses numerous violations
Relevant Data Total Drainage Area = 18.5 acres Impervious Area = 6.2 acres Concerned Property Owner
Issues Regarding Design Plans • Original plan was approved by local governments • Developer placed level spreader in the Neuse Buffer • Town will not accept stormwater system until developer addresses numerous violations
Property Owner CommentsExcerpt from Emails to Local Government Officials • “When we picked out this property, the site had been bulldozed and the grates could not be seen.” • “The plot plan provided by the realtor showed the drainage easement but did not disclose the level spreaders.” • “Unless it is a very light rain or a sprinkle the area usually sees water.”
Meeting Agenda • Dinner and Welcome • Kenn Gardner, Wake County • Stormwater Case Studies • 1) Flooding • 2) Stream Quality • 3) Sedimentation & Erosion Control • 4) Secondary & Cumulative Impacts
What is the 303(d) list? • States are required develop a list of waters not meeting water quality standards or which have impaired uses. • Listed waters must be prioritized, and a management strategy or total maximum daily load (TMDL) must subsequently be developed for all listed waters.
3,000+ total stream miles in Wake County 94 miles of Wake County streams designated as “impaired” 47% of all streams were monitored; 28% of those streams were impaired Most common source of impairment is “urban runoff /storm sewers” The State Agrees that Stream Condition and Water Quality is an Issue in Wake County 2006 State Listing (303d) of Impaired Streams Added/Delisted Streams Kenneth Creek (delisted) Neills Creek (added)
Stream Quality Guest Speaker • Mark SeniorCity of Raleigh Senior Project Engineer • Will discuss the needs and issues in Pigeon House Branch
Case Study: Stream QualityPigeon House Branch Drainage Basin • Total Drainage Area = 3,200 acres • Highly Urbanized; Draining Downtown Raleigh • Placed on 303(d) list for Copper, Fecals & Biological Integrity • Pollution Sources: Urban Runoff/Storm Sewers & Industrial Discharges
Pigeon House Branch Drainage Basin Wade Ave Glenwood Ave Capital Blvd
Meeting Agenda • Dinner and Welcome • Kenn Gardner, Wake County • Stormwater Case Studies • 1) Flooding • 2) Stream Quality • 3) Sedimentation & Erosion Control • 4) Secondary & Cumulative Impacts
Potential Sources of Sediment in Streams • Upland Erosion • Land disturbance Activities • Agricultural and Farming Operations • Developed Areas • Streambank Erosion
Wake County Land Area BreakdownNote: Only includes area outside WSW and outside public right-of-way Source: Wake County Tax Parcel Database (Sept. 2005)
Relative Contribution of Various Sources of Sediment in Urban Watershed (WA State)(Nelson and Booth, 2002) • 27 acres disturbed per day = 15.4 square miles per year (1.8% of Wake County) • 3,275 miles* of streams in Wake County (* based on source of data) Many studies generally point to streambank erosion as the primary source of sediment in urbanizing watersheds
Local Disturbed Area Sedimentation Rates Location: Carpenter Village, Crabtree Creek and Village of Woodsong, Brunswick County