Download
1 / 1
10 likes | 95 Views
Elizabeth Gutting Survey Question Order and the Political Party Preferences of College Students and Their Parents, Daniel J. Willick and Richard K. Ashley. Public Opinion Quarterly, Volume 35, Issue 2 (Summer 1971), pages 189-199.

E N D
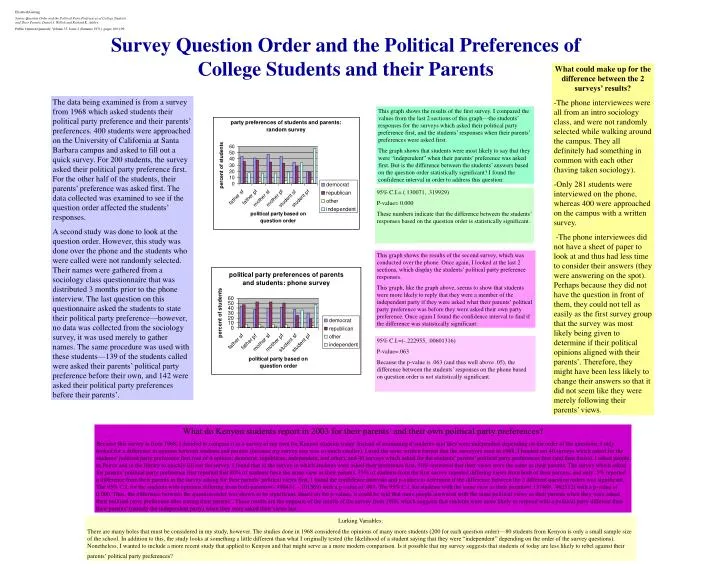
Elizabeth Gutting Survey Question Order and the Political Party Preferences of College Students and Their Parents, Daniel J. Willick and Richard K. Ashley. Public Opinion Quarterly, Volume 35, Issue 2 (Summer 1971), pages 189-199. Survey Question Order and the Political Preferences of College Students and their Parents What could make up for the difference between the 2 surveys’ results? -The phone interviewees were all from an intro sociology class, and were not randomly selected while walking around the campus. They all definitely had something in common with each other (having taken sociology). -Only 281 students were interviewed on the phone, whereas 400 were approached on the campus with a written survey. -The phone interviewees did not have a sheet of paper to look at and thus had less time to consider their answers (they were answering on the spot). Perhaps because they did not have the question in front of them, they could not tell as easily as the first survey group that the survey was most likely being given to determine if their political opinions aligned with their parents’. Therefore, they might have been less likely to change their answers so that it did not seem like they were merely following their parents’ views. The data being examined is from a survey from 1968 which asked students their political party preference and their parents’ preferences. 400 students were approached on the University of California at Santa Barbara campus and asked to fill out a quick survey. For 200 students, the survey asked their political party preference first. For the other half of the students, their parents’ preference was asked first. The data collected was examined to see if the question order affected the students’ responses. A second study was done to look at the question order. However, this study was done over the phone and the students who were called were not randomly selected. Their names were gathered from a sociology class questionnaire that was distributed 3 months prior to the phone interview. The last question on this questionnaire asked the students to state their political party preference—however, no data was collected from the sociology survey, it was used merely to gather names. The same procedure was used with these students—139 of the students called were asked their parents’ political party preference before their own, and 142 were asked their political party preferences before their parents’. This graph shows the results of the first survey. I compared the values from the last 2 sections of this graph—the students’ responses for the surveys which asked their political party preference first, and the students’ responses when their parents’ preferences were asked first. The graph shows that students were most likely to say that they were “independent” when their parents’ preference was asked first. But is the difference between the students’ answers based on the question order statistically significant? I found the confidence interval in order to address this question: 95% C.I.= (.130071, .319929) P-value= 0.000 These numbers indicate that the difference between the students’ responses based on the question order is statistically significant. This graph shows the results of the second survey, which was conducted over the phone. Once again, I looked at the last 2 sections, which display the students’ political party preference responses. This graph, like the graph above, seems to show that students were more likely to reply that they were a member of the independent party if they were asked what their parents’ political party preference was before they were asked their own party preference. Once again I found the confidence interval to find if the difference was statistically significant: 95% C.I.=(-.222955, .00601316) P-value=.063 Because the p-value is .063 (and thus well above .05), the difference between the students’ responses on the phone based on question order is not statistically significant. What do Kenyon students report in 2003 for their parents’ and their own political party preferences? Because this survey is from 1968, I decided to compare it to a survey of my own for Kenyon students today. Instead of examining if students said they were independent depending on the order of the questions, I only looked for a difference in opinion between students and parents (because my survey size was so much smaller). I used the same written format that the surveyors used in 1968. I handed out 40 surveys which asked for the students’ political party preference first (out of 4 options: democrat, republican, independent, and other), and 40 surveys which asked for the students’ parents’ political party preferences first (and then theirs). I asked people in Peirce and in the library to quickly fill out the survey. I found that in the survey in which students were asked their preference first, 50% answered that their views were the same as their parents. The survey which asked for parents’ political party preference first reported that 80% of students have the same view as their parents. 35% of students from the first survey reported differing views from both of their parents, and only .5% reported a difference from their parents in the survey asking for their parents’ political views first. I found the confidence intervals and p-values to determine if the difference between the 2 different question orders was significant. The 95% C.I. for the students with opinions differing from both parents=(-.498431, -.101569) with a p-value of .003. The 95% C.I. for students with the same view as their parents=(.137488, .462512) with a p-value of 0.000. Thus, the difference between the question order was shown to be significant. Based on the p-values, it could be said that more people answered with the same political views as their parents when they were asked their political party preference after stating their parents’. These results are the opposite of the results of the survey from 1968, which suggests that students were more likely to respond with a political party different than their parents’ (namely the independent party) when they were asked their views last. Lurking Variables: There are many holes that must be considered in my study, however. The studies done in 1968 considered the opinions of many more students (200 for each question order)—80 students from Kenyon is only a small sample size of the school. In addition to this, the study looks at something a little different than what I originally tested (the likelihood of a student saying that they were “independent” depending on the order of the survey questions). Nonetheless, I wanted to include a more recent study that applied to Kenyon and that might serve as a more modern comparison. Is it possible that my survey suggests that students of today are less likely to rebel against their parents’ political party preferences?