Download

1 / 27
270 likes | 374 Views
The global commodification of wastewater.

E N D
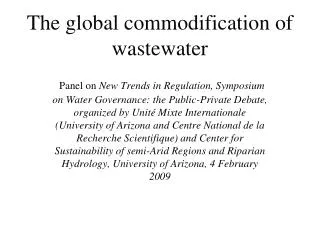
The global commodification of wastewater Panel on New Trends in Regulation, Symposium on Water Governance: the Public-Private Debate, organized by Unité Mixte Internationale (University of Arizona and Centre National de la Recherche Scientifique) and Center for Sustainability of semi-Arid Regions and Riparian Hydrology, University of Arizona, 4 February 2009
THE GLOBAL COMMODIFICATION OF WASTEWATER Christopher Scott cascott@email.arizona.edu Udall Center for Studies in Public Policy, & Dept. of Geography & Regional Development University of Arizona
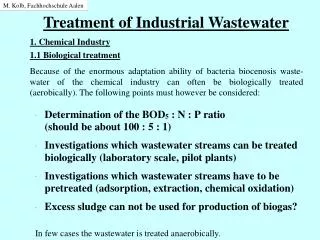
Wastewater Boom • Urbanization • Water supply • Expanding sewerage (collection & “disposal”) • Millennium Development Goals investments • Yet… wastewater (as treated effluent and raw sewage): • a traded commodity (informal and increasingly formal markets) • regulated using overly simplistic, antiquated frameworks • receives inadequate investment, management & policy • research emphasis on case study documentation
Water & Sanitation in the • Millennium Development Goals • (targets to achieve by 2015) • • MDG 1 Eradicate extreme poverty and hunger• MDG 2 Achieve universal primary education• MDG 3 Promote gender equality and empower women• MDG 4 Reduce child mortality• MDG 5 Improve maternal health• MDG 6 Combat HIV/AIDS, malaria and other diseases• MDG 7 Ensure environmental sustainability • MDG7, Target 3: Reduce by half the proportion of people worldwide without safe drinking water and basic sanitation
Sobering Demographics • 880 million additional population by 2015, virtually all in developing countries. • After 2015, all worldwide growth in population will take place in developing country cities.
Urban Explosion • India to cross the 50-50 urban-rural population threshold… 750 million urban Indians by 2050. • China is actively planning for cities each with more than 100 million population. • Africa’s urban population growth rates among the highest in the world. • Latin America predominantly urban for decades. • Western U.S. experiencing rapid urban growth.
Urban Water Supply Growth Millennium Development Goals face resource constraints (water, investment). Progress towards sanitation goals lagging behind water supply; therefore, wastewater management is critical.
In 1990 - 23% of the world’s population lacked safe drinking water and 51% lacked adequate sanitation Today - roughly 1.1 billion people still live in conditions of water stress or scarcity; 2.6 billion people lack any improved sanitation facilities MDG Challenge - Supply water to 1.2 billion additional people (100 million / yr or 260,000 / day) - Provide sanitation to 1.8 billion (180 million / yr or 400,000 / day)
DRINKING WATER COVERAGE Between 1990-2002, access rose from 77% to 83%
SANITATION COVERAGE Between 1990-2002, coverage rose from 49% to 58%
FINANCING GLOBAL WATER GOALS • ESTIMATED COSTS TO MEET THE 2015 WATER AND SANITATION TARGETS (HIGHLY VARIABLE) • $10-12 BILLION (WHO-UNICEF) • – water access and basic sanitation • $49 BILLION (Camdessuss Report) • – full water ($17bill), sewage connections and • primary wastewater treatment ($32bill) • $180 BILLION (World Water Commission) • – maintain full water supply (drinking, agriculture, energy, industry) • and sanitation needs by 2025 Acknowledgment: Anthony Rock, Arizona State University bud.rock@asu.edu
SOURCES OF GLOBAL WATER FINANCING • 64 % - Domestic public sector financing at the national or local level (from taxes, user fees, public debt, etc.) • 19% - Direct investments from domestic private sources • 5% - Direct investments from international private sources • 12% - International sources of support and cooperation including multilateral and bilateral Overseas Development Assistance
USG INVESTMENT FY 2003-2005 $1.7 BILLION IN ODA 100 WATER AND RELATED PROJECTS 24 MILLION PEOPLE RECEIVED IMPROVED WATER ACCESS 26 MILLION PEOPLE RECEIVED ACCESS TO IMPROVED SANITATION 15 USG AGENCIES AND DEPARTMENTS SUPPORTED INTERNATIONAL WORK (WITH VIRTUALLY NO DIRECT APPROPRIATIONS) KEY AREAS INCLUDED: AFGHANISTAN, BANGLADESH, COLOMBIA, EGYPT, ETHIOPIA, HAITI, INDIA, INDONESIA, KENYA, NEPAL, PAKISTAN, PHILIPPINES, SOMALIA, SUDAN, UGANDA, NILE BASIN, OKAVANGO BASIN
ESTIMATED FINANCIAL SUPPORT FOR GLOBAL WATER PROGRAMS BY LEADING USG FUNDER, FY2005 USAID $397.7 million Millennium Challenge Corporation $89.9 million Environmental Protection Agency $79.3 million Department of State $36.0 million Department of Defense $3.4 million total >$600 million (figure excludes Iraq and Afghanistan – additional $290 million) (loans, guarantees, and insurance can average an additional $200 million)
Selected International Organizations Fiscal Year 2005 Organization U.S. Contribution % of Core Budget to Core Budget Spent on Water UNICEF $342.00M 10.4% WHO $96.11M 1.9% UNESCO $77.00M 8.1% UNDP $108.00M 13.1% WMO $11.00M 4.6% UNEP $6.00M 12.3% FAO $81.62M 0.8% Total $721.73M (The U.S. does not earmark contributions to core budget, but by comparative percentage $36.6M was spent on water programs.)
WASTEWATER IMPLICATIONS • Treatment not part of MDGs • National finance woefully inadequate (e.g., India $7 billion investment is 10% of needed) • Most existing plants not working (Ghana 7 plants working of 57 total)
Prescott ValleyArizonaEffluent AuctionOct. 2007 • 2,724 acre-feet (3.36 million cubic meters) of effluent per year • Winning bid of $24,650/ acre-foot = $67M by Water Property Investors, LLC (New York) • Floor price $19,500/ AF by Aqua Capital Management (Nebraska) - year-long negotiation, delayed initial auction • Nominated for “Water Deal of the Year”
Commodity, Resource, or Hazard? • Wastewater value high in water-scarce regions • Latent irrigation and environmental demand • Increases land values • Growing resource-value for urban reuse • Wastewater markets & informal trading expected to increase • Current regulation absent or highly disarticulated (minimizing hazard impact; little attention to wastewater resource or “service”)
Multiple uses, multiple users Overlapping jurisdictions Environmental protection Agriculture/ irrigation Civil society Wastewater Regulation • Water supply • Urban development • Public health • Need coherent institutional framework • Promote beneficial reuse while mitigating risk • ‘Polluter pays’ principle to mobilize funds • Stockholm Framework - adaptive, evolutionary
Risk Mitigation • ‘Yuck’ factor, public opinion • Trust in authorities? • Reuse and growth (landscaping & turf?) • Environmental use more benign - but may not compete in markets • Agricultural reuse with crop restrictions (non-edible and fodder) • Scott, C.A., N.I. Faruqui, L. Rachid-Sally (eds.) 2004. Wastewater Use in Irrigated Agriculture. CAB International, Wallingford - free download from: http://www.idrc.ca/en/ev-31595-201-1-DO_TOPIC.html
Thanks.For further information, see:udallcenter.arizona.edu/wrpg/waterreuse.html