Download
1 / 15
160 likes | 217 Views
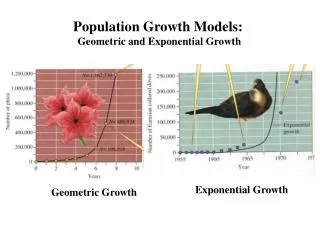
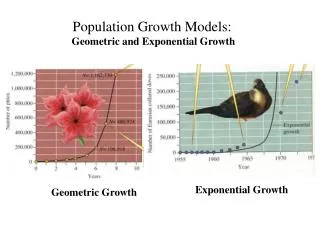
Population Growth Models. Module 4 Lesson 2. Growth is measured as exponential or logistic growth. Exponential Growth: Occurs when a population grows faster and faster as time goes on . (referred to as a J curve)

E N D
Population Growth Models Module 4 Lesson 2
Growth is measured as exponentialor logisticgrowth. Exponential Growth: Occurs when a population grows faster and faster as time goes on. (referred to as a J curve) Logistic Growth: When exponential growthslows down and eventually stops as it reaches carrying capacity. (referred to as a S curve) Exponential Growth Logistic Growth Types of population Growth By Bigmadrich
What happens when you supply a population with all the food and space it needs, protect it from predators and disease, and remove its waste products? • Will the Population Grow? • Will the Population Shrink? • Will it stay the same? • Why? Exponential Growth
If an environmentis able to provide the population with unlimited resources • it will grow exponentially. • Population will increase because: • Members are able to produce offspring who will later produce more offspring • Members will live longer without disease • No predatorsto increase death rate • Plenty of space for territoriesand shelter • High population of mates Exponential Growth
Exponential Growth • During Exponential Growth: • The size of each generation of offspring will be larger than the generation before it. • The largera population gets, the fasterit grows. • Under perfectconditions • with unlimited resources, • a population will grow • exponentially. Exponential Growth is shown on the graph with the characteristic J-Curve wikipedia
The rate of exponential • growth variesamong differentorganisms. • Some organisms reproduce rapidly • Some organisms reproduce slowly • Organisms reproduce at different ratesdepending on their current environment. Exponential Growth and reproductive rates Different Organisms reproduce at different rates depending on biology or their environment.
Some organisms reproducemore quickly than others • Huge populations can develop in weeks and even hours • Bacteria reproduce by binary fission, by splitting in half. • Some bacteria can reproduce in just 20minutes! • If nothing interferes with population growth, populations would become infinitely large! Exponential Growth Organisms that rapidly reproduce Binary Fission By ZabMilenko
Many organisms must wait until they reach sexual maturity to reproduce and waitbetween pregnancies to reproduceagain. • Elephants become sexually mature at 10 years old and have single offspring every 2-4 years. • Larger species tend to reach sexual maturity slower than smaller species. **All species with unlimited resources and absence of predation will ultimately grow exponentially Exponential Growth Organisms who reproduce slowly
When some organisms are moved into a • newenvironment, the population may • grow exponentiallyespecially if the new • environment has: • Ample Resources and Space • LowPredation and Disease • Often these species become invasive. • Examples: • Hydrilla • Gypsy Moths • Kudzu • Lion Fish Exponential Growth Organisms in new environments
Most populations do not grow exponentially for too long. • Eventually the population stopsexponential growth. • Logistic Growth: occurs when a populations growth slows and then stops, following a period of exponential growth. • Several Factors Trigger Logistic Growth: • Birthrate • Death Rate • Immigration and Emigration • Space • Resources • Disease and Parasites Logistic growth
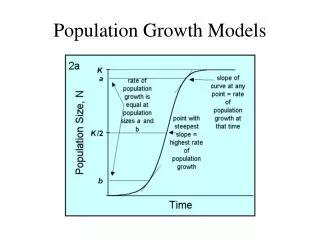
Logistic Growth Curves have a characteristic “S” Shape • Grow begins exponentially, slows, and then becomes stable. Growth may slow because of: • Death increase • Birth decline • Immigration or emigration Populations stabilize at their carrying capacity Logistic growth curve Graphing Logistic Growth Creates a “S-Shaped” Graph Where in this graph would you see stabilization by carrying capacity?
Logistic Growth Occurs in ThreePhases: • Phase 1: Exponential Growth • Resources unlimited • Low deathrate and highbirth rate • Phase 2: Growth Slows • Populations still grows, • but slows down • Phase 3: Growth Stops • Rate of growth drops to zero • Birthrate and death rate are near equal • Population will remain near this size indefinitely Phases of logistic growth How can the stages of Logistic Growth be compared to a traffic light?
Population growth affects the environment • The IPAT model: I = P x A x T x S • Our total impact (I) on the environment results from the interaction of population (P), affluence (A) and technology (T), with an added sensitivity (S) factor • Population = individuals need space and resources • Affluence = greater per capita resource use • Technology = increased exploitation of resources • Sensitivity = how sensitive an area is to human pressure • Further model refinements include education, laws, ethics Humanity uses 1/3 of all the Earth’s net primary production
Calculating The Growth Rate • Crude Growth Rate formula = • Crude Birth Rate – Crude Death Rate = Crude Growth Rate • Crude Rates are based on 1,000 individuals • Population Change Formula = • (birth rate + immigration rate) – (death rate + emigration rate) = Population Change • The CGR for the Earth is roughly 1.2% right now ! Example: In 1950, the population of a small suburb in Los Angeles, California, was 20,000. The birth rate was measured at 25 per 1000 population per year, while the death rate was measured at 7 per 1000 population per year. Immigration was measured at 600 per year while emigration was measured at 200 per year. Calculate the population size in 1951. Calculate the rate of increase for population growth. Population = starting pop + births – deaths + immigration – emigration Population = 20000 + 500 – 140 + 600 – 200 Population = 20,760 Growth rate = birth rate – death rate = 25/1000 – 7/1000 = 18/1000 or written as 18 per 1000
Rule of 70 • Provides a simple way to calculate the approximate number of years it takes for the level of a variable growing at constant rate. • States the approximate number of years n for a variable growing at the constant growth rate of R percent, to double • n = 70/R • example, a city with an annual population growth rate of 5% will double its population in approximately 14 years. If the growth rate were 7%, it would double its population in approximately 10 years. • n = 70/5 = 14 • n = 70/7 = 10 • ***NOTE: PERCENTAGES are NOT reduced to their decimal equivalents • Just remember "Rule of 70" whenever you hear that something is growing by some percentage, or that something is growing steadily. That means it's going to double -- and probably sooner than you think!