Download

1 / 0
0 likes | 223 Views
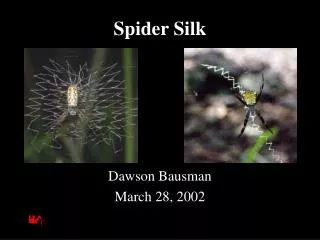
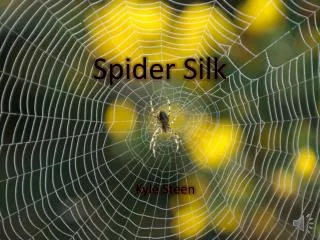
Do now: -Take the papers off the side counter -Write down tonight’s homework -Start Working on the Spider Silk article/graph. Parts of a Bar Graph. UNITS. TITLE. Amount of Precipitation in Raleigh, NC. Amount of Precipitation (cm). LABELS for EACH AXIS. Month. Reading a Bar Graph.

E N D