Download
1 / 15
150 likes | 285 Views
Graph Visualization. CSC4170 Web Intelligence and Social Computing Tutorial 2 Tutor: Tom Chao Zhou Email: czhou@cse.cuhk.edu.hk. Outline. Background Graph Visualization Tools Case Study: Pajek Q & A. Background. Visualization is a technique to graphically represent sets of data.

E N D
Graph Visualization CSC4170 Web Intelligence and Social Computing Tutorial 2 Tutor: Tom Chao Zhou Email: czhou@cse.cuhk.edu.hk
Outline • Background • Graph Visualization Tools • Case Study: Pajek • Q & A
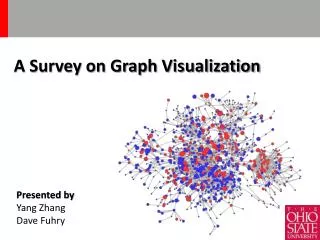
Background • Visualization is a technique to graphically represent sets of data. • When data is large or abstract, visualization can help make the data easier to read or understand.
Visualization Tools • Pajek: http://pajek.imfm.si/doku.php?id=pajek • UCINET: http://www.analytictech.com/downloaduc6.htm • Netdraw: http://www.analytictech.com/Netdraw/netdraw.htm • Stocnet: http://stat.gamma.rug.nl/stocnet/ • Manyeyes: http://manyeyes.alphaworks.ibm.com/manyeyes/ • …
Case Study: Pajek • Pajek: • Program for Large Network Analysis. • Download page: • http://pajek.imfm.si/doku.php?id=download • Manual: • http://vlado.fmf.uni-lj.si/pub/networks/pajek/doc/pajekMan.pdf
Case Study: Pajek • Draw “Network” with Pajek: • List of neighbours (Arcslist/Edgeslist) (unweighted graph) • Pairs of lines (Arcs/Eges) (weighted graph) • Matrix
Case Study: Pajek • List of neighbours (Arcslist/Edgeslist) *Vertices 5 1 “a” 2 “b” 3 “c” 4 “d” 5 “e” *Arcslist 1 2 4 2 3 3 1 4 4 5 *Edgeslist 1 5 • Words, starting with *, must be written in first column of the line. • Definition of vertices followed after that – to each vertex we give a label. • using *Arcslist, a list of directed lines from selected vertices are declared. • *Edgeslist, declares a list of undirected lines. • No empty lines are allowed.
Case Study: Pajek 1, read the .net file 1, draw the network
Case Study: Pajek • Every arc/edge is defined separately in new line – initial and terminal vertex are given. • Directed lines are defined using *Arcs, undirected lines are defined using *Edges, the third number in rows defining the weight. • Pairs of lines (Arcs/Edges) *Vertices 5 1 "a" 2 "b" 3 "c" 4 "d" 5 "e" *Arcs 1 2 1 1 4 1 2 3 2 3 1 1 3 4 2 4 5 1 *Edges 1 5 1
Case Study: Pajek In this format directed lines are given in the matrix form (*Matrix). We can transform bidirected arcs to edges. • Matrix *Vertices 5 1 "a" 2 "b" 3 "c" 4 "d" 5 "e" *Matrix 0 1 0 1 1 0 0 2 0 0 1 0 0 2 0 0 0 0 0 1 1 0 0 0 0
Case Study: Pajek • Export to bmp, eps…
Case Study: Pajek • Computing indegree and outdegree using Pajek: double click Partitions
Case Study: Pajek • Graph and Digraph Glossary example: • Derived from Bill Cherowitzo's Graph and Digraph Glossary. • http://www-math.cudenver.edu/~wcherowi/courses/m4408/glossary.html • An arc (X,Y) from term X to term Y exists in the network iff in the Graph and Digraph Glossary the term Y is used to describe the meaning of term X.