Download
1 / 33
330 likes | 486 Views
Section 1.3. The Normal Distributions. Topics. Density curves Normal distributions The 68-95-99.7 rule The standard normal distribution Normal distribution calculations Standardizing observations Normal quantile plots. Density curves. Density curve.

E N D
Section 1.3 The Normal Distributions
Topics • Density curves • Normal distributions • The 68-95-99.7 rule • The standard normal distribution • Normal distribution calculations • Standardizing observations • Normal quantile plots
Density curve • Imagine a smooth curve thru the top of the bars on a histogram: it is an idealized mathematical model for the data • Curve lies on or above the horizontal axis (non-negative) • Has area exactly = 1 underneath it. • Area under this curve for a given range give an estimate of the chance of an observation falling in that range • Let’s look again…
Definitions • Mode – Location where the curve is high-peaked • Median – the equal-areas point. Half the area on each side. • Mean – the balance point of the density curve • Think of placing a wedge so that the density would balance like on a see-saw or teeter totter • Hard to visually find the mean for skewed curves • Mathematical formulas are used to calculate the mean, median, standard deviation, etc.
Symbols • μ– mean of the idealized distribution (of the density curve) • σ– standard deviation of the idealized distribution • – mean of the actual observations (sample mean) • s – standard deviation of the actual observations (sample standard deviation)
Normal Distribution • Symmetric, unimodal, bell-shaped • Characterized by mean (μ) and stdev (σ). • Mean is the point of symmetry • Can visually speculate σ (inflection point?) • Good description of many real variables (test scores, crop yields, height) • Approximates many other distributions
Normal Distribution • Described only by mean and standard deviation • Instead of writing it out each time, we shorthand Normal using N and put the mean and stdev in parenthesis: general normal: N(µ, σ) standard normal: N(0,1)
68-95-99.7 rule for normal distribution • Approximately 68% of the observations fall within σ of the mean μ. • Approximately 95% of the observations fall within 2σ of the mean μ. • Approximately 99.7% of the observations fall within 3σ of the mean μ.
Example: heights of young women • The distribution of heights of young women aged 18 to 24 is approximately normal with mean µ = 64.5 inches and standard deviation σ = 2.5 inches. • Between what two points do 68% of the women fall into? 95%? 99.7%?
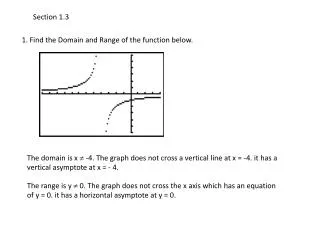
Finding probabilities for normal data • Tables for normal distribution with mean µ = 0 and stdevσ = 1 (N(0,1)) are available • see page T-2 near the back of the book • First learn how to find out different types of probabilities for N(0,1) (standard normal curve). • Then learn to convert ANY normal distribution to a standard normal and find the corresponding probability
Examples • What proportion of observations on a standard normal variable Z take values • less than 2.2 ? • greater than -2.05 ?
What about backwards? • If I give you a probability, can you find the corresponding z value? called percentiles • What is the z-score for the 25th percentile of the N(0,1) curve? • 90th percentile?
Standardizing • z-score – standardized value of x (how many standard deviations from the mean) • Example: Compute the standardized scores for women 70 inches tall and 60 inches tall. (μ=64.5 σ=2.5)
Standard Normal Distribution • The standardized values for any distribution always have mean 0 and standard deviation 1. • If the original distribution is normal, the standardized values have normal distribution with mean 0 and standard deviation 1 • We call this the standard normal distribution
Example • In 2003 the scores of students taking SATs were approximately normal with mean 1026 and standard deviation 209. • What percent of all students had the SAT scores of at least 820? (limit for Division I athletes to compete in their first college year) • What percent of all students had scores between 720 and 820? (partial qualifiers)
Example • In 2003 the scores of students taking SATs were approximately normal with mean 1026 and standard deviation 209. • How high must a student score in order to place in the top 20% of all students taking the SAT? • Berry’s score was the 68% percentile, what score did he receive?
Normal quantile plots (SAS:qqplot) • To make QQplot: • Arrange the data from smallest to largest and record corresponding percentiles. • Find z-scores for these percentiles (for example z-score for 5th percentile is z=-1.645.) • Plot each data point against the corresponding z. • If the data distribution is close to normal the plotted points will lie close to the 45 degree straight line.
Summary (1.3) • Hypothesized mathematical models for distributions: Density curves • Normal Distribution • Evaluating probabilities for standard normal distribution • Evaluating probabilities for ANY normal distribution by converting it to a standard normal distribution • Normal quantile plot (qqplot)