Download
1 / 4
40 likes | 249 Views
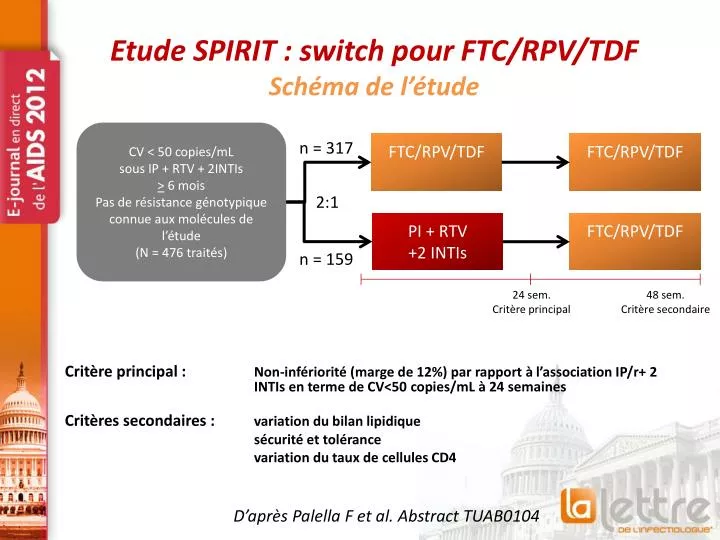
Etude SPIRIT : switch pour FTC/RPV/ TDF Schéma de l’étude. CV < 50 copies/ mL sous IP + RTV + 2INTIs > 6 mois Pas de résistance génotypique c onnue aux molécules de l’étude (N = 476 traités). n = 317. FTC/RPV/TDF. FTC/RPV/TDF. 2:1. PI + RTV +2 INTIs. FTC/RPV/TDF. n = 159.

E N D
Etude SPIRIT : switch pour FTC/RPV/TDFSchéma de l’étude CV < 50 copies/mLsous IP + RTV + 2INTIs> 6 moisPas de résistance génotypique connue aux molécules de l’étude(N = 476 traités) n = 317 FTC/RPV/TDF FTC/RPV/TDF 2:1 PI + RTV+2 INTIs FTC/RPV/TDF n = 159 24 sem.Critère principal 48 sem.Critère secondaire Critère principal :Non-infériorité (marge de 12%) par rapport à l’association IP/r+ 2 INTIs en terme de CV<50 copies/mL à 24 semaines Critèressecondaires :variation du bilanlipidique sécurité et tolérance variation du taux de cellules CD4 D’après Palella F et al. Abstract TUAB0104
Critère principal : réponse viro-immunologique à S 24 (analyse en ITT) • Le switch pour FTC/RPV/TDF est non inférieurà la poursuite du traitement par IP/r +2INTIs IC 95% pour la différence 10 93,7 % En faveur de FTC/RPV/TDF En faveur de IP/r+2INTIs 89,9 % 9 8 FTC/RPV/TDF IP/r + 2INTIs 7 6 % de patients 5 -1,6 3,8 9,1 4 3 2 5,4 % 5,0 % 1 5,0 % 0,9 % 0 Succès virologique(CV< 50 copies/mL) Echecvirologique Absence de donnéesà S 24 -12 % 0 12 % Variation du taux de CD4 (cellules/mm3) : FTC/RPV/TDF + 20 vsIP/r + 32 (p=0,28) D’après Palella F et al. Abstract TUAB0104
Echec virologique : patients avec CV > 50 copies/ml à S 24 • IP/r + 2 INTIs (n=8) • 7 sans génotyperéalisé (CV <400 c/mL) • 1 génotype: M184V • CV au moment de l’analyse 13,300 c/mL • FTC/RPV/TDF (n=3) • 1 sans génotyperéalisé (CV<400 c/mL) • 1 génotype: M184I • CV au moment de l’analyse 410 c/mLa • 1 génotype: M184I, V90Ib, L100I, K103N • CV au moment de l’analyse 11,900 c/mLa 10 5,0 Patients avec échec virologiqueanalyse en snapshot (%) 5 0,9 3/317 8/159 n/N 0 FTC/RPV/TDF IP/r+2INTIs • Traitement post-étude : FTC/TDF+DRV+RTV • Présente à l’inclusion D’après Palella F et al. Abstract TUAB0104
Evolution du bilan lipidique Ratio CT:HDL CT LDL-c TG HDL-c 0,08 • Le switch FTC/RPV/TDF permetuneaméliorationsignificative du score à 10 ans de risque de Framingham à S 24 en comparaisonà IP/r +2INTIs (p=0,001) 0,1 10 3 0 0 0 -1 -1 -4 -10 Variation moyenne depuis l’inclusion (mg/dL) -0,1 Change in TC:HDL ratio -20 -16 -0,2 -30 -25 -0,3 -0,27 -40 FTC/RPV/TDF -50 IP/r+2INTIs -53 -60 p<0,001 pour toutes les comparaisons inter traitements (ANOVA ) Moyenne des valeurs à l’inclusion (mg/dL) 192194 121124 163173 5350 3,864,08 D’après Palella F et al. Abstract TUAB0104