Download
1 / 15
150 likes | 299 Views
Water Quality in the Anacostia River. Tony Smith December 1, 2005. Introduction. Purpose: identify sources of contaminant Data NHD (USGS) NED (USGS) Land cover (USGS) USGS bioavailability studies (Phelps 2002, 2003, 2004) Conclusion. PAHs. Polycyclic aromatic hydrocarbons

E N D
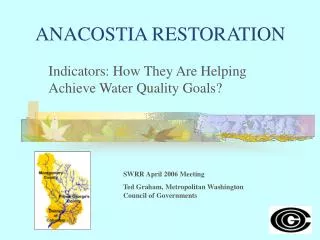
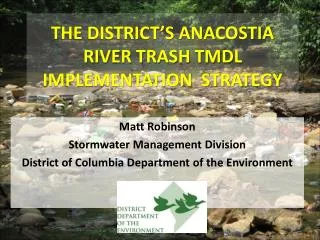
Water Quality in the Anacostia River Tony Smith December 1, 2005
Introduction • Purpose: identify sources of contaminant • Data • NHD (USGS) • NED (USGS) • Land cover (USGS) • USGS bioavailability studies (Phelps 2002, 2003, 2004) • Conclusion
PAHs • Polycyclic aromatic hydrocarbons • occur naturally • produced in combustion reactions • Known or suspected carcinogens and mutagens • Integrated Risk Information System • RfD (naphthalene): 20 μg / kg day (estimate of daily exposure to population without appreciable deleterious effect)
The Anacostia River • Watershed • covers 176 square miles • home to 800,000 • Three main drainage areas • northwest (32%) • northeast (45%) • Tidal (23%) • 1988 - 1995: spills totaling 60,000 gallons • “One of America’s 10 worst rivers”
Predictions based on land cover • High concentrations in tidal drainage streams • Little contaminant contribution from NW and NE branches
Summary of Data and Conclusion • 20 of 23 higher than reference (p<0.05) • Clam survival 6 – 98% • NE and Tidal Branches are primary contributors • Beltsville Agricultural Research Center is US EPA National Priority Site • US Navy Yard, Washington Gas Light Facility
Additional Factors • Sediment • Stream gage • Suspended sediment • Precipitation • Frequency of water quality monitoring • Scope of land cover classification • EPA Priority Sites