Download
1 / 9
90 likes | 210 Views
Resident Chart Audit and QI Project. Everyone and Larry Ward, MD. Chart Audits. Ultimate goal is to improve quality of care Adherence to guidelines for therapeutic and preventive measures Also a method for measuring prevalence Newly mandated by the ACGME

E N D
Resident Chart Audit and QI Project Everyone and Larry Ward, MD
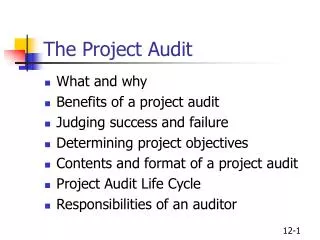
Chart Audits • Ultimate goal is to improve quality of care • Adherence to guidelines for therapeutic and preventive measures • Also a method for measuring prevalence • Newly mandated by the ACGME • Mandated as part of IM recertification
Resident Chart Audits • Performed for at least 3 of the last 4 years • Method changed last year: • 2nd and 3rd years choose 15 charts to review between January and March • Cancer screening • Diabetes management • HTN management • CAD management
Resident Chart Audits • Data for the entire practice is collated • Over 900 charts reviewed this year • Reviewed during Preclinic conference in April • Each individual is given the following: • Their own raw and collated data • Entire practice data for 2008 and 2009 • National data • IBC data for Jones Hall and MGP
Results • Compared with 2008: Prevention • 74% Flu vaccine (+ 5%) • 79% Pneumovax (+10%) • 72% Mammogram (+ 1%) • Colorectal screening (unreliable) • PAP smears (- 7%)
Results • Compared with 2008: CAD • 79% B-blocker (+3%) • 84% on Anti-platelet (+5%) • 61% LDL <100 (+9%)
Results • Compared with 2008: Diabetes • 73% A1c check in last 6 months (0%) • 75% A1c <9.0 (New) • 59% seen Ophtho (+ 9%) • 61% LDL <100 (+ 9%) • 60% at BP goal <130/90 (- 1%) • 86% on ACE/ARB (+ 0%)
Conclusion • Improvements in most areas compared with 2008. • Compares favorably with national data. • Residents to develop personal, data driven QI plans this upcoming year. • Mid year review with faculty • Repeat chart audit (?by peers?) next spring • QI initiatives in the practice this year targeting deficiencies