Download
1 / 53
530 likes | 605 Views
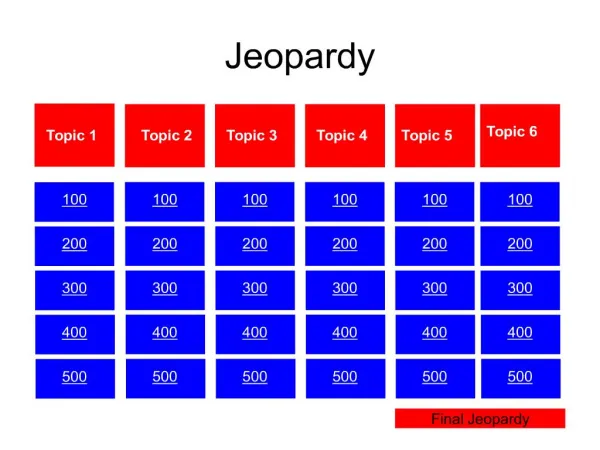
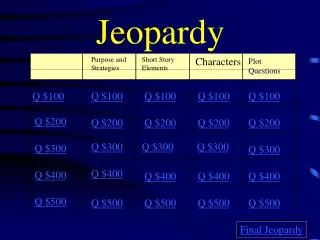
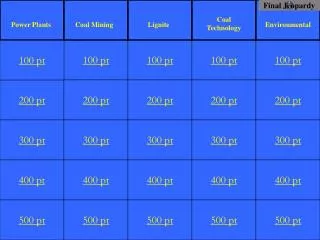
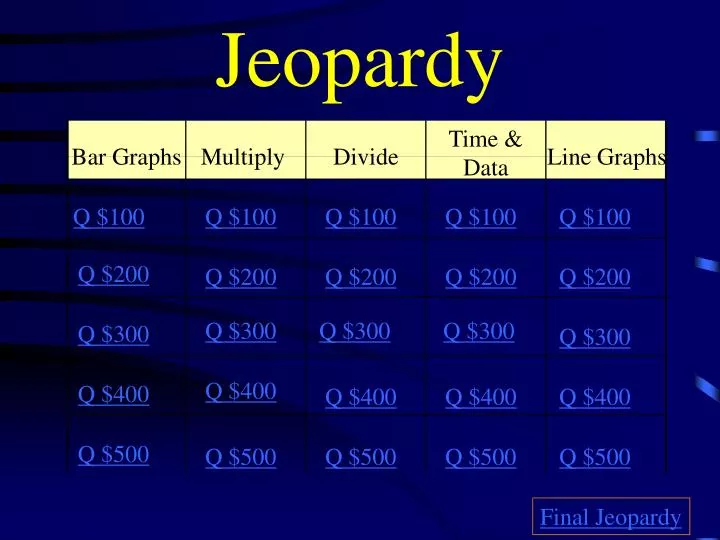
Jeopardy. Time & Data. Bar Graphs. Multiply. Divide. Line Graphs. Q $100. Q $100. Q $100. Q $100. Q $100. Q $200. Q $200. Q $200. Q $200. Q $200. Q $300. Q $300. Q $300. Q $300. Q $300. Q $400. Q $400. Q $400. Q $400. Q $400. Q $500. Q $500. Q $500. Q $500. Q $500.

E N D
Jeopardy Time & Data Bar Graphs Multiply Divide Line Graphs Q $100 Q $100 Q $100 Q $100 Q $100 Q $200 Q $200 Q $200 Q $200 Q $200 Q $300 Q $300 Q $300 Q $300 Q $300 Q $400 Q $400 Q $400 Q $400 Q $400 Q $500 Q $500 Q $500 Q $500 Q $500 Final Jeopardy
The graph shows how many students ate each kind of fruit with their lunch on Monday. How many more students ate apples than ate grapes?
A school bus picks up 54 students each day. The distance each student lives from school is shown on the graph below. How many students live 9 or more miles from school?
Hal made this graph to show the number of hours that he worked for four weeks. If Hal earned $6 an hour, how much money did he earn during Week 2?
The graph shows the number of students in each fourth-grade class at Lake View Elementary. Which 2 teachers have a combined total of 46 students?
$400 Answer from H1 Mr. Long and Mr. Pérez
$500 Answer from H1 • Title • X-Axis (title & labels) • Y-Axis (title & scale) • Bars
17 x 3 = n What is n?
$100 Answer from H2 n= 51
57 x 9 = h What is h?
$200 Answer from H2 h= 513
$300 Answer from H2 $150.00
40 x r = 320 What is r?
$500 Answer from H2 2,024
64 ÷ 8 = n What = n?
$100 Answer from H3 n= 8
$450 ÷ 5= n What = n?
$200 Answer from H3 n= $90
$300 Answer from H3 12 R3
What is the range of this data set? 6, 2, 4, 8, 7, 2, 6, 6, 5, 8
What is the mode of this data set? 6, 2, 4, 8, 7, 2, 6, 6, 5, 8
What time is shown? • A quarter to seven • half-past seven • 2 minutes before • eight • 23 minutes before • seven
$300 Answer from H4 • 23 minutes before • seven
The 4th graders practiced singing for their school recital. The tally table shows how many hours they sang each week. How many 4th graders practiced for the recital?
$500 Answer from H4 Median = 20 Mode= 20 Range= 35
$100 Answer for H5 $2.65
$200 Answer for H5 Thursday and Friday
$300 Answer from H5 4 days