Download
1 / 44
450 likes | 741 Views
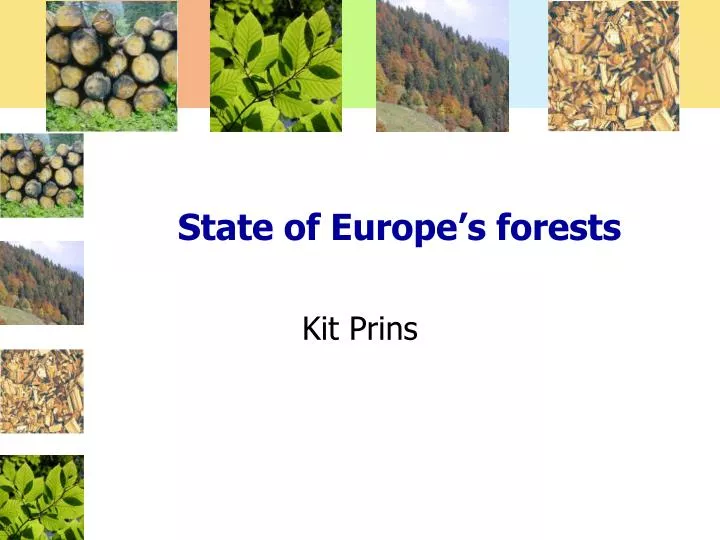
State of Europe’s forests. Kit Prins. Outline. What do Europeans want from their forests? Are they getting what they want? Challenges from outside the forest sector. Where are Europe’s forests? (source: Schuck et al. Paivinen et al. EFI, 2001/2). Huge differences: from this . to this.

E N D
State of Europe’s forests Kit Prins
Outline • What do Europeans want from their forests? • Are they getting what they want? • Challenges from outside the forest sector
Where are Europe’s forests?(source: Schuck et al. Paivinen et al. EFI, 2001/2)
How to tell whatEuropeanswantfromtheirforests? • Askthem (surveys etc.) • Look atoutcome of policyprocesses • Makedeductionsfrom pan-European set of criteria and indicators of sustainableforest management
What do Europeanswantfromtheirforests (based on C&I)? • No loss of resource • Continuedhealth and vitality • Production of goods and services • Conservation of biodiversity • Protection of soil, water and infrastructure • Income, employment and othersocio-economicbenefits • Cultural values • Good governance, value for money
Criterion 1: Forest resources and their contribution to global carbon cycles • Forests are 45% of land area and expanded by 0.8 million ha/year • Forest area available for wood supply has declined in many regions • For 20 years, growing stock has expanded by 430 million m3 (0.37%) per year • Europe’s forests are major carbon sinks and stores: annual carbon sequestration of 870 million tonnes is equivalent to 10% of gross GHG emissions
Criterion 2: Forest ecosystem health and vitality • Sulphur deposition decreasing, nitrogen and ammonia stable or increasing. Critical loads exceeded on 49/106 plots. • Nitrogen deposition causes disturbed organic matter and nutrient cycling on 14% of plots (30% in Central-West Europe) • Almost one fifth of trees “damaged”. On 29% of the plots forest health deteriorated between 1998 and 2009 (insects, fungal diseases and weather extremes most widespread influencing factors, all may increase with climate change). • Insects and diseases are the damaging agent most frequently observed, followed by wildlife and grazing. 1 percent of the European forest area is affected by one or more damaging agents (6 percent for Europe without the Russian Federation)
Criterion 3: Productive functions (wood and non-wood) • Ratio of fellings to net annual increment 39% (62% without Russia) • Value of marketed roundwood €21.1 billion in 2010. Average value varied from €5/ha to €241/ha (FAWS only). • Value of marketed non-wood goods €2.76 billion: stars are Christmas trees, cork, game meat, fruits/berries/nuts • Value of marketed forest services (15 countries only) at €818 million, especially for “social” services (i.e. recreation). • Most forests are under management plan or equivalent (but problems of comparability!)
Criterion 4: Forest biodiversity • Decrease in single species stands (-0.6% per year) • 70% natural regeneration (without Russia, where 98%), increasing. • 87% “semi-natural” (without Russia) • 9 million ha dominated by introduced species, no change • Average volume of deadwood 20.5 m3/ha. Some evidence that change to more nature oriented management can be observed in forest characteristics • Gene conservation: 476 000 ha for in situ and 7 700 ha for ex situ, for 139 tree species. Still significant gaps for geographical representativeness of in situ conservation • Status and change of connectivity and share of core forest can now be mapped • Better data on threatened forest species: difficult to interpret • Increase in area of protected forests: now 38.4 million ha (without RU) for biodiversity and landscape together (18%). +0.5 million ha/year. Strong variation in concepts and practice.
Criterion 5: Protective functions • Nearly 20% of forest and other wooded land protects water supplies, prevents erosion (11%, including Russia). Importance recognised, but mechanisms vary • In reporting countries, 7% of forest protects infrastructure and managed natural resources
Criterion 6: socio-economic functions • Public and private forest both about 100 million ha (excluding Russia). Private forest expanded by 15% because of privatisation and restitution. • Forest sector (including industries) contributes about 1% of GDP: more in some countries, generally share is falling • Net value added per ha per region varies widely, generally increasing, negative in a few countries • Reported government expenditure for forest services varies from €0.8/ha to €86/ha: comparability problems, but differences real • 3.95 million people employed in sector (including industries): number falling. Workforce aging. • Forestry work remains very dangerous and accident prone. Few improvements, despite stated objectives. Mechanisation helps. • Wood consumption rising, until recession. Per head, ranges from 0.8 m3 to 3.0 m3 • Europe net exporter, trade doubled between 1990 and 2005, affected by recession • Wood contributed 3.7% of energy in Europe without Russia. Knowledge improving a lot. • At least 90% of forests accessible for recreation, less than 10% has recreational use as a major management goal. Weak data on forest visits • Over one million sites with cultural and spiritual values identified
The policy challenges • How should the forest sector contribute to mitigating climate change? • How can wood contribute to renewable energy supply? • Adapting to climate change and protecting forests • Protecting forest biodiversity: at what cost? • Supplying renewable and competitive forest products to Europe and the world • Achieving and demonstrating sustainability • Developing appropriate policies and institutions
The best strategy for mitigation in the European forest sector • Combine • Increasedsequestration in forestbiomass (longer rotations, highershare of thinnings) • Steady flow of wood for products and energy • However • In the long run, the sequestrationcapacitylimitwillbereached, and the onlywayforwardwillbe to increasestorage in products and substitution
It istechnically possible to meetwoodenergytargets, assuming: • Energyefficiency • Fastergrowth for otherrenewables • Major wood mobilisation • Sixfoldincrease in use of harvestresidues, stumps • Strongdevelopment of non-forest sources • Reduction of 20 million m3 for industry • (but no imports or short rotation coppice)
However, this would imply: • Impoverishment of forest sites (extraction of residues, stumps) • Social and economic costs of intense mobilisation • Reduction in biodiversity • Less attractive for recreation
EFSOS II proposes a balanced approach to expanding wood energy: • Promoteenergyefficiency • Develop non-woodrenewablesevenfaster • Implement Guidelines for wood mobilisation • Develop non-forestwood (landscape care wood, recoveredwood) • Cascade principle • Fastgrowingbiomass plantations • Burnwoodefficiently and cleanly • Import fromsustainable sources
Adaptation to climate change: threats • Higherfrequency of severeevents • Change in speciescompetitiondynamics, negativeconsequences for thoseoutsidetheir optimum range (e.g. spruce in dry lowlands) • Invasive alienspecies: trees, shrubs, but alsoinsects • Combinedeffects of climate change and air pollution • No new « stable state »: high fluctuations and uncertaintywillbecome normal • NB regionaldifferences
Main aim: increase adaptive capacity of forests • Takeregionalapproaches to: • Regeneration (species, method) • Tending and thinning: regulating composition • Harvesting: age of trees, areas • Pest and disease management, fireprevention • Monitor and document results, adaptapproaches as needed and shareexperience
It is possible to improve the biodiversity of Europe’sforests Consequences for woodsupply • Deadwood v. residue use • Less land available for woodsupply • Longer rotations • But close-to nature management on protected areas couldpartlycompensate High carbon accumulation Win-win: recreation, protection, air quality all positivelyaffected by priority to biodiversity Win-lose: biodiversity v. highwoodenergy mobilisation
Innovation and competitivity • Innovation (or the lack of it) will influence the long termdevelopment of the sector in powerful but unexpectedways • Products (e.g. smart paper), processes (e.g. bio-refineries), above all, attitudes • Potential for innovation in forest management, led by state forest organisations • Governmentsshouldlead the search for a culture of innovation – not only for forests
Achieving and demonstratingsustainability: the challenges • DEVELOP concepts and methodswhich are comprehensive, feasible, objective, sociallyaccepted and takeaccount of variety of situations • USE the methods to evaluatepolicychoices • COMMUNICATEwithothersectors and the public in simple and objective terms How wouldyou propose to assess the sustainability of forest management??
Policies and institutions • Policies, institutions and instruments in Europe are, in general, stable, recent and effective • National forest programmes (NFPs) have improved public acceptance of forestpolicy goals • Total governmentspending ~ €18.4/ha • Objectives have been formulated for the main policy challenges, and some instruments put in place • Challenges are complex and long term, requiresophisticatedpolicymaking, sharplyfocused instruments and strongpoliticalwill
Kit Prins Kit.prins@gmail.com +41 78 739 1491 Thank you for your attention