Download
1 / 1
10 likes | 172 Views
Awesome-Sauce Stuff Learned in CSE 3! By Jeffrey Truong. Dynamic Webpage Programming with JavaScript Programming with javascript to create very useful things! Such as a Q&A and also a menu calculator online. Making Information Available to the World with HTML and Web Pages

E N D
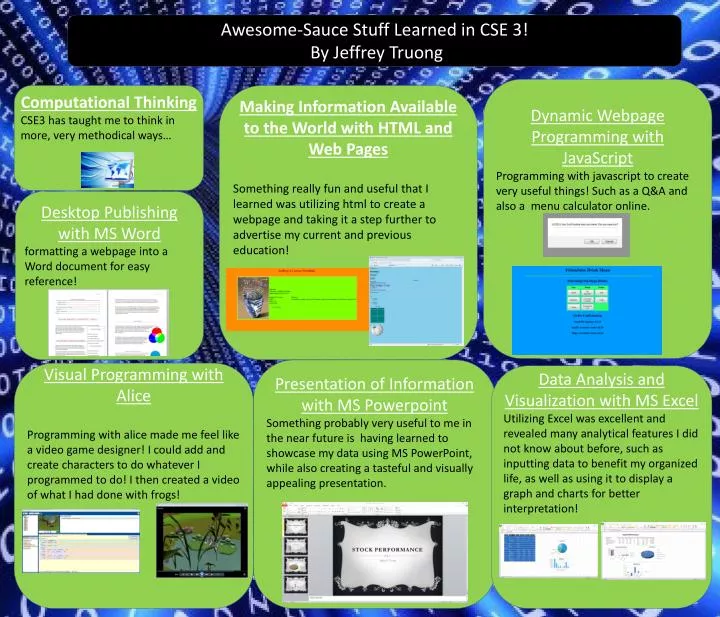
Awesome-Sauce Stuff Learned in CSE 3! By Jeffrey Truong Dynamic Webpage Programming with JavaScript Programming with javascript to create very useful things! Such as a Q&A and also a menu calculator online. Making Information Available to the World with HTML and Web Pages Something really fun and useful that I learned was utilizing html to create a webpage and taking it a step further to advertise my current and previous education! Computational Thinking CSE3 has taught me to think in more, very methodical ways… Desktop Publishing with MS Word formatting a webpage into a Word document for easy reference! Presentation of Information with MS Powerpoint Something probably very useful to me in the near future is having learned to showcase my data using MS PowerPoint, while also creating a tasteful and visually appealing presentation. Visual Programming with Alice Programming with alice made me feel like a video game designer! I could add and create characters to do whatever I programmed to do! I then created a video of what I had done with frogs! Data Analysis and Visualization with MS Excel Utilizing Excel was excellent and revealed many analytical features I did not know about before, such as inputting data to benefit my organized life, as well as using it to display a graph and charts for better interpretation!