Download
1 / 6
60 likes | 67 Views
A modified version of the standard dual-wavelength radar technique is introduced to overcome deficiencies in rain retrievals. The modified algorithm shows superior accuracy and robustness compared to the standard method.

E N D
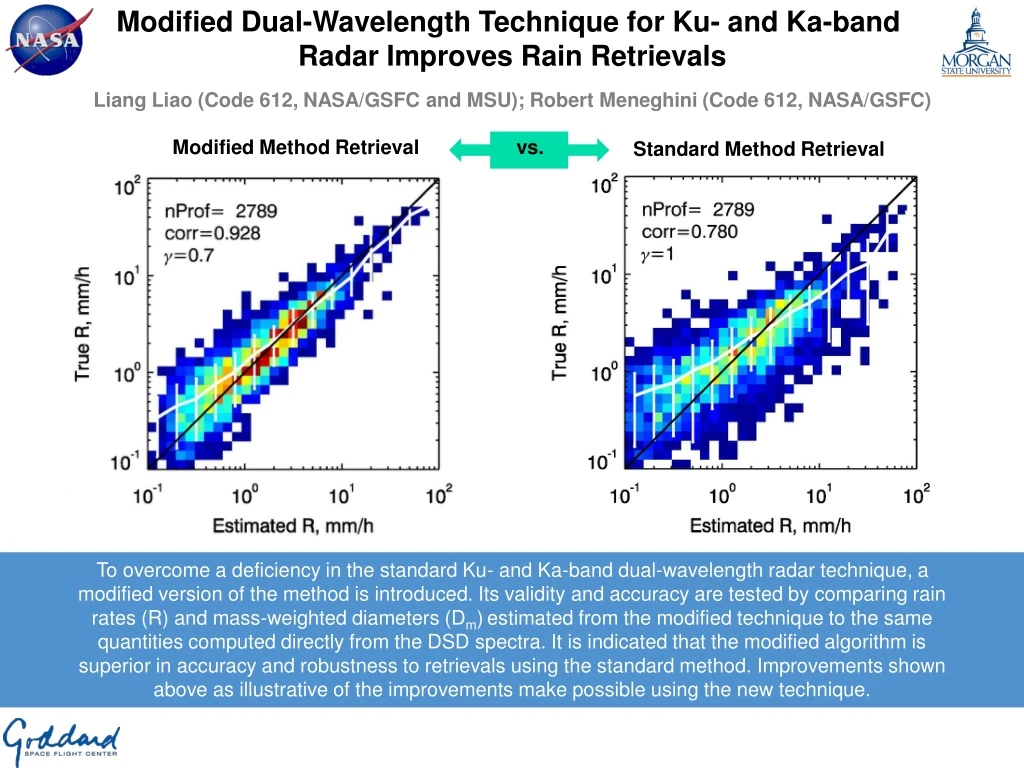
Modified Dual-Wavelength Technique for Ku- and Ka-band Radar Improves Rain Retrievals Liang Liao (Code 612, NASA/GSFC and MSU); Robert Meneghini (Code 612, NASA/GSFC) Modified Method Retrieval Standard Method Retrieval vs. To overcome a deficiency in the standard Ku- and Ka-band dual-wavelength radar technique, a modified version of the method is introduced. Its validity and accuracy are tested by comparing rain rates (R) and mass-weighted diameters (Dm)estimated from the modified technique to the same quantities computed directly from the DSD spectra. It is indicated that the modified algorithm is superior in accuracy and robustness to retrievals using the standard method. Improvements shown above as illustrative of the improvements make possible using the new technique.
Name: Liang Liao, NASA/GSFC, Code 612 and MSU E-mail: liang.liao-1@nasa.gov Phone: 301-614-5718 References: Liao, L, and R. Meneghini, 2019: A modified dual-wavelength technique for Ku- and Ka-band radar rain retrieval. J. Appl. Meteor. Climatol., 58, 3–18, https://doi.org/10.1175/JAMC-D-18-0037.1. Data Sources: The DSD data used in this study primarily from measurements made by Parsiveldisdrometers during the Iowa Flood Studies (IFloodS) field experiment from May 1 to June 15, 2013, the Integrated Precipitation Validation Experiment (IPHEx) from May 1 to June 15, 2014, and the observations at the NASA Wallops Flight Facility in Wallops Island, Virginia from 2013 to 2014. This work was supported by Dr. R. Kakar of NASA Headquarters under NASA’s Precipitation Measurement Mission (PMM) Grant NNH15ZDA001NPMM. The authors also wish to thank Dr. Ali Tokay from University of Maryland Baltimore County for providing DSD data. Technical Description of Figures: Graphic 1: (Left)Two-dimensional probability density functions of rainfall rate (R) estimated by the modified technique with an adjustable parameter γ of 0.7 with its true values at the surface. The one-to-one line is given by the black solid curve while the means and twice the standard deviations of the data are given by the white solid curves and vertical bars, respectively. Graphic 2: (Right) Two-dimensional probability density functions of rainfall rate (R) estimated by the dual-wavelength standard technique, i.e., γ=1, with its true values at the surface. The one-to-one line is given by the black solid curve while the means and twice the standard deviations of the data are given by the white solid curves and vertical bars, respectively. Scientific significance, societal relevance, and relationships to future missions:An important goal of the Dual-frequency Precipitation Radar (DPR) operating at Ku- and Ka-band, aboard the Global Precipitation Measurement (GPM) core satellite, is to derive rain rate and raindrop size distribution (DSD). Several dual-wavelength radar retrieval techniques have been developed which are based on uses the differential frequency ratio (DFR), i.e., the ratio (or difference in dB) of radar reflectivities between two wavelengths, to first infer the DSD parameters, correct attenuation, and then derive the rain rate profile gate by gate either stepping forward or backward along the radar beam. To overcome a deficiency in the standard Ku- and Ka-band dual-wavelength radar technique, a modified version of the method is introduced. The deficiency arises from ambiguities in the estimate of the mass-weighted diameter (Dm) of the raindrop size distribution derived from DFR. In particular, for DFR values less than zero, there are two possible solutions of Dm, leading to ambiguities in the retrieved DSD parameters. It is shown that the double solutions to Dm are effectively eliminated if the DFR is modified from Zku–ZKa to ZKu–γZKa (in dB) where γ is a constant with a value less than 0.8. An optimal radar algorithm that uses the modified DFR for the retrieval of rain and Dm profiles is developed. The validity and accuracy of the algorithm are tested by applying it to radar profiles that are generated from measured DSD data. Comparisons of the rain rates and DSD parameters estimated from the modified DFR algorithm to the same hydrometeor quantities computed directly from the DSD spectra (or the truth) indicate that the modified DFR-based profiling retrievals perform fairly well, and are superior in accuracy and robustness to retrievals using the standard DFR. Overall improvements in rain rate and raindrop size distribution using the new method are found not only at the surface but also for entire range profiles. High-quality quantification of rainfall rate is vital for societal applications such as water resource management and severe weather observation, and the GPM constellation provides near-global coverage of surface precipitation. Improvements to estimates from the GPM core observatory will propagate to other constellation sensors. This technique, in some modified form, will also be applicable to the upcoming Aerosol, Cloud, Convection, and Precipitation (ACCP) Designated Observable from the 2017 Earth Science Decadal Survey. Earth Sciences Division - Atmospheres
Cloud Observations from DSCOVR EPICYuekui Yang1, Kerry Meyer1, Galina Wind1,2, Yaping Zhou1,3, Alexander Marshak1, Steven Platnick4 1Code 613, NASA/GSFC; 2SSAI; 3Morgan State Univ.; 4Code 610AT, NASA/GSFC The Earth Polychromatic Imaging Camera (EPIC) has been providing continuous observations of the sunlit side of the Earth from the L1 Lagrangian point since June 2015. We have developed algorithms that generate standard EPIC Level 2 Cloud Products such as cloud mask, cloud effective pressure/height, and cloud optical thickness. These products are publicly available for climate studies and for generating other geophysical products that require cloud properties as input. Earth Sciences Division - Atmospheres
Name: Yuekui Yang, NASA/GSFC, Code 613 E-mail: yuekui.yang@nasa.gov Phone: 301-614-6313 References: Yang, Y., Meyer, K., Wind, G., Zhou, Y., Marshak, A., Platnick, S., Min, Q., Davis, A. B., Joiner, J., Vasilkov, A., Duda, D., and Su, W.: Cloud products from the Earth Polychromatic Imaging Camera (EPIC): algorithms and initial evaluation, Atmospheric Measurement Techniques, 12, 2019-2031, https://doi.org/10.5194/amt-12-2019-2019, 2019. Data Sources: NASA DSCOVR EPIC Data – Level 2 cloud products Version 1 available at the Atmospheric Science Data Center (ASDC) at NASA Langley Research Center (https://eosweb.larc.nasa.gov/project/dscovr/dscovr_epic_l2_cloud_01). Technical Description of Figures: Images: EPIC L2 cloud product examples for Aug. 18, 2016, 08 UTC: (a) EPIC RGB image; (b) EPIC cloud mask. Spc: space pixels, ClrHC: high confidence clear, ClrLC: low confidence clear, CldLC: low confidence cloudy, and CldHC: high confidence cloudy; (c) oxygen A-band cloud effective pressure; (d) cloud optical thickness assuming liquid phase; (e) cloud optical thickness assuming ice phase; (f) most likely cloud phase. Other L2 cloud products not shown include oxygen B-band cloud effective pressure, and A- and B-band cloud effective height. The EPIC cloud mask adopts the threshold method and utilizes multichannel observations and ratios as tests. Cloud effective pressure/height is derived with observations from the O2 A-band (780 nm and 764 nm), and B-band (680 nm and 688 nm) pairs. The EPIC cloud optical thickness retrieval adopts a single channel approach where the 780 nm and 680 nm channels are used for retrievals over ocean and over land, respectively. Scientific significance, societal relevance, and relationships to future missions: The Earth Polychromatic Imaging Camera (EPIC) onboard the Deep Space Climate Observatory (DSCOVR) satellite has been providing a continuous view of the sunlit side of the Earth from the Earth-Sun system L1 Lagrangianpoin, since June 2015. Our algorithms generate standard EPIC Level 2 Cloud Products, such as cloud mask, cloud effective pressure/height, and cloud optical thickness. Comparison with co-located cloud retrievals from geosynchronous earth orbit (GEO) and low earth orbit (LEO) satellites shows that the EPIC cloud product algorithms are performing well and are consistent with theoretical expectations. These products are publicly available at the Atmospheric Science Data Center (ASDC) at the NASA Langley Research Center for climate studies and for generating other geophysical products that require cloud properties as input. Our work has shown that observations from the 10 EPIC spectral channels are unique for cloud viewing and cloud product development, and also demonstrate the utility and advantages of deep space vantage points for Earth monitoring. Earth Sciences Division - Atmospheres
Mapping the Oxidizing Capacity of the Global Remote Troposphere In Situ Observations Laboratory, Code 614, NASA/GSFC and JCET/UMBC a) ATom observations c) Monthly mean tropospheric [OH] ATom 1 ATom 2 + b) OMI global HCHO The hydroxyl radical (OH) destroys methane and is central to the chemistry of the lower atmosphere. We combine airborne observations from NASA’s Atmospheric Tomography (ATom) mission with OMI retrievals of formaldehyde (HCHO) to infer the distribution of total-column OH throughout the remote troposphere. This novel dataset reveals regional-scale natural and anthropogenic perturbations and can guide efforts to improve simulations of global atmospheric composition.
Name: Glenn Wolfe, NASA/GSFC, Code 614 and JCET E-mail: glenn.m.wolfe@nasa.gov Phone: 301-614-6008 References: Wolfe, G. M. (614/JCET), Nicely, J. M. (614/ESSIC), St Clair, J. M. (614/JCET), Hanisco, T. F. (614), Liao, J. (614/USRA), Oman, L. D. (614), Brune, W. B., Miller, D., Thames, A., González Abad, G., Ryerson, T. B., Thompson, C. R., Peischl, J., McKain, K., Sweeney, C., Wennberg, P. O., Kim, M., Crounse, J. D., Hall, S. R., Ullmann, K., Diskin, G., Bui, P., Chang, C. and Dean-Day, J., “Mapping hydroxyl variability throughout the global remote troposphere via synthesis of airborne and satellite formaldehyde observations,” Proceedings of the National Academy of Sciences of the United States of America, 116(23), 11171-11180, doi:10.1073/pnas.1821661116. Data Sources: ATom observations are publicly available at https://doi.org/10.3334/ORNLDAAC/1581. The specific datasets derived here, including the ATom OH merge, ATom integrated columns, gridded OMI HCHO columns, and X[OH], are available at https://doi.org/10.3334/ORNLDAAC/1669. Technical Description of Figures: a): Flight tracks of the NASA DC-8 (inset) for ATom 1 (August 2016, orange) and ATom 2 (February 2017, blue). Each missions consists of ~11 flights traversing the remote atmosphere with constant vertical profiling from near the surface to 10 – 12 km altitude. The scientific payload includes extensive in situ observations of trace gas and aerosol properties, including HCHO (measured by the GSFC in situ airborne formaldehyde (ISAF) instrument) and OH concentrations. ATom observations allow us to both quantify the HCHO – OH relationship and validate OMI HCHO retrievals. b): Total column abundance of formaldehyde from August 2016, derived from the Smithsonian Astrophysical Observatory Ozone Monitoring Instrument retrieval (OMI-SAOv003). Columns are averaged over the whole month on a 0.5° x 0.5° grid. The color scale ranges from 0 to 1×10¹⁶ molecules cm-2. Data over land are masked to better highlight the variability of HCHO in remote regions, which is largely driven by OH. c): August 2016 column-average tropospheric OH concentrations (X[OH]) derived from a combination of ATom insights, OMI retrievals, and additional parameters from GSFC’s GMI model. Median uncertainty in individual grid cells is 0.35×10⁶ molecules cm-3. This is the first ever satellite-derived estimate of the near-global distribution of OH. Note, it is currently only possible to apply this technique in remote regions (over water). Scientific significance, societal relevance, and relationships to future missions: The hydroxyl radical (OH) is central to myriad atmospheric processes. OH is highly variable in space and time, but current observation-based methods cannot resolve local and regional OH gradients. Such information is crucial both for understanding the processes that modulate OH and for isolating issues in global models, which currently cannot accurately simulate OH. This new product represents a novel application of existing satellite data and will help us better interpret contemporary trends in the budgets of methane (a potent greenhouse gas) and ozone (a major pollutant and oxidant source). Future research will focus on refining this technique for wider application (e.g. over land, on longer timescales), as well as leveraging recent (TROPOMI) and upcoming (TEMPO) orbital observations of atmospheric composition for increased resolution and precision.