Download
1 / 18
180 likes | 266 Views
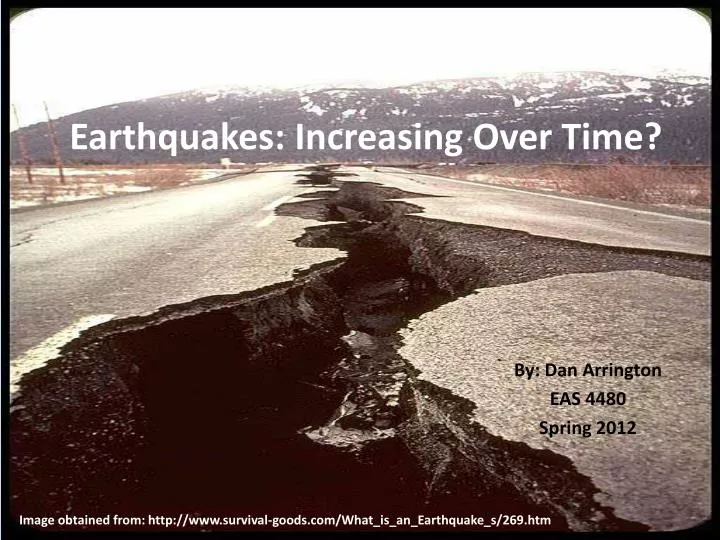
Earthquakes: Increasing Over Time?. By: Dan Arrington EAS 4480 Spring 2012. Image obtained from: http://www.survival-goods.com/What_is_an_Earthquake_s/269.htm. Background Information. Richter Scale Measures magnitude Energy released follows log scale: log Es = 4.8 + 1.5Ms

E N D
Earthquakes: Increasing Over Time? By: Dan Arrington EAS 4480 Spring 2012 Image obtained from: http://www.survival-goods.com/What_is_an_Earthquake_s/269.htm
Background Information • Richter Scale • Measures magnitude • Energy released follows log scale: log Es = 4.8 + 1.5Ms Es is the energy released in joules. Ms is the magnitude of the earthquake. Source: http://en.wikipedia.org/wiki/Richter_magnitude_scale
Why is it important? • Earthquakes can be deadly and cause widespread damage. Haiti – Magnitude 7.0; 200,000+ Deaths Japan – Magnitude 8.9; 10,000+ Deaths Source: http://disastersstrike.blogspot.com/2011/03/haiti-compared-to-japan.html Es = 1.995 x 10¹⁵ J Es = 1.413 x 10¹⁸ J
It’s About Location • The San Andreas Fault Zone is well known • The New Madrid Fault Zone is much larger • It would be a good idea to make some assessments. A few things to consider are: • Awareness of geographic location • Enforcement of building codes • Implementing warning systems Source: http://endoftheamericandream.com/archives/is-the-new-madrid-fault-earthquake-zone-coming-to-life
Data • I looked at long term and short term data. I wanted to see if the numbers of earthquakes per year are increasing over time. • The long term data spans a century, from 1900-1999. I compared the first half to the second half of the century. • The short term data compares 20 year increments, 1970-1989 and 1990-2009.
Long Term Procedure • For the 100 years of data, I looked at major (7 to 7.9) to great (8+) earthquakes only. This is because before the 1930’s the catalog is only complete down to magnitude 7. • I plotted the data to look at trends. Then I did a least squares regression, reduced major axis regression, and principal component regression. I also calculated the correlation coefficient using the corrcoef() function and bootstrap method. • I also tested for normality of the residuals using the chi-squared test. If normal, I could apply the F-test to see if the data has equal variances. If equal, I could apply the Student’s t-test to see if the means of the data are equal.
Long Term Results 1943: 32 Magnitude 7+ Earthquakes 1960: 14 Magnitude 7+ Earthquakes
Long Term Results (cont.) pLSQ = -0.1682 pRMAR = -0.8066 pPCR = -0.4031 Total Earthquakes, 1950-1999: 701 Total Earthquakes, 1900-1949: 852
Long Term Results (cont.) 95% Confidence rlow = -0.4601 rhigh = 0.0742 Result Insignificant Small Correlation Using corrcoef() r = -0.2085 p = 0.1462 Mean r = -0.2090
Long Term Results (cont.) • Chi-squared value: 14.9340 • Critical Chi-squared value:14.0671 • Data doesn’t follow a normal distribution. • F-test can’t be applied • Student’s t-test can’t be applied
Short Term Procedure • I looked at major to great earthquakes and plotted the data. I did all of the same regressions here as I did for long term. • I calculated the correlation coefficient using the corrcoef() function and bootstrap method. • Finally, applied the Chi-Squared test to check for normality and see if other tests could be applied.
Short Term Results (cont.) pLSQ = 0.1596 pRMAR = 0.6793 pPCR = 0.2740 Total Earthquakes, 1970-1989: 261 Total Earthquakes, 1990-2009: 297
Short Term Results (cont.) 95% Confidence rlow = -0.2317 rhigh = 0.6136 Result Insignificant Small Correlation Using corrcoef() r = 0.2349 p = 0.3188 Mean r = 0.2150
Short Term Results (cont.) • Chi-Squared value: 8.1197 • Critical Chi-Squared value: 14.0671 • F value: 2.1674 • Critical F value: 2.1683 • h 0 • % Significance for t: 0.0926 • 95% Confidence Interval: [-3.9117 0.3117]
Conclusions • Based on the long term results, there is not an increasing trend in the number of major and great earthquakes per year. • Based on the short term results, however, there seems to be an increasing trend. • Neither long term or short term results have a large correlation. • I feel that the number of major and great earthquakes occurring each year follow a pattern, and trends can be found based on what time periods you compare.
Sources • Data Sources: • http://earthquake.usgs.gov/research/data/centennial.php • http://www.johnstonsarchive.net/other/quake1.html • Other Sources: • http://en.wikipedia.org/wiki/Richter_magnitude_scale • http://earthquake.usgs.gov/learn/faq/?faqID=33 • http://www.survival-goods.com/What_is_an_Earthquake_s/269.htm • http://disastersstrike.blogspot.com/2011/03/haiti-compared-to-japan.html • http://endoftheamericandream.com/archives/is-the-new-madrid-fault-earthquake-zone-coming-to-life