Download
1 / 14
150 likes | 313 Views
ISI-MIP: the health sector – 1st intercomparison of malaria models. Franziska Piontek . www.isi-mip.org. Teams involved. LMM_RO (Liverpool Malaria Model) Monthly Model – Andrew Morse, Cyril Caminade (U Liverpool) MARA – Cyril Caminade (U Liverpool)

E N D
ISI-MIP: the health sector – 1st intercomparison of malaria models Franziska Piontek www.isi-mip.org
Teams involved • LMM_RO (Liverpool Malaria Model) Monthly Model – Andrew Morse, Cyril Caminade (U Liverpool) • MARA – Cyril Caminade (U Liverpool) • VECTRI – Adrian Tompkins, Felipe Colón-González (Abdus Salam International Centre for Theoretical Physics, Trieste, Italy) • UMEA Statistical Model – Joachim Rocklov, Hans Stenlund (Umea University, Sweden) • MIASMA Model – Pim Martens (U Maastricht), Cyril Caminade (U Liverpool)
Runs • 5 GCMs, 4 RCPs • SSP2 population for people at risk metric • present constant climate to isolate additional effect of climate change
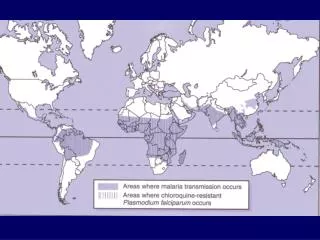
Available data in the data archive • 0.5x0.5° spatial resolution, annual and decadal data (Umea model: only decadal) • cs = climate suitability 0 or 1 for each grid cell • Length of transmission season # of months (VECTRI: # of days, Umea did not provide this variable)
Paper also estimates additional population at risk & additional person months at risk • SSP2 population projections, gridded (first version) • PAR: population present in area where climate is suitable for malaria transmission (cs > 0.5) • PMAR: length of transmission season x population in a given grid cell • PAR and PMAR attributable to climate change: difference between sceanrio with climate change and scenario with current climate (GCM-specific baseline climate) • 3 time periods: 2020s (2005-2035), 2050s (2035-2065), 2080s (2069-2099)
Results • Large spread between malaria model results • Also affected by lack of agreement between climate models • Historical validation against observations – mixed results between models, depends on assumption of world with/without intervention on malaria • Increase in climate suitability has limited meaning for prediction of actual spread of malaria due to missing socio-economic factors + questions of actual spread of vector/pathogen • Overall climate change effects likely to be small
Historical validation Kovats at al., submitted to PNAS
Results: effect of climate scenarios on future malaria distribution – changes in lts between 1980-2010 and 2069-2099 periods, mean of all GCMs Kovats at al., submitted to PNAS > 60% of model agreement
Additional population at risk due to CC impacts – spread over impact models Kovats at al., submitted to PNAS
LMM_RO Monthly Model • Input: monthly rainfall and temperature • # of adult mosquitos in one month ~ to rainfall in previous month • Combine population with data on biting rate, sporogonic cycle length (development of infecting forms of malaria parasite in mosquito), survival probability based on monthly temperature reproduction ratio R0 • Malaria transmission in that month if R0>1
MARA model • Very simplified seasonal model of malaria transmission, originally developed for Africa only • Conditions for malaria occurrence: • 3 month rainfall > minimum value • Catalyst month with rainfall > another minimum value • Temperature > threshold value • Seasonality index based on standard deviation of monthly rainfall Malaria on or off
VECTRI model • Dynamical model, daily timestep, accounting for sub-seasonal variations in climate – most sophisticated model in the study • Accounts for impact of temperature and rainfall variability on mosquito in larval and adult stage as well as of parasite • Rainfall effects on transmission represented by physically-based model of surface pool hydrology – low rainfall increase in available breeding sites • Accounts for human population density in calculation of biting rates – dilution of parasite ratio for higher population densities • Requires population migration to transport malaria to new regions becoming suitable for transmission
UMEA Statistical Model • Regression models empirically estimate relation between endemic malaria transmission and climatic factors on global scale • Also takes into account socio-economic factors
MIASMA Model • Models temperature effects on survival probability and biting frequency of mosquitos calculate transmission potential as critical vector density required for sustainable disease transmission • Additional assumption: minimum level of monthly rainfall of 80 mm • No constraint by current distribution of malaria vectors