Download
1 / 10
100 likes | 246 Views
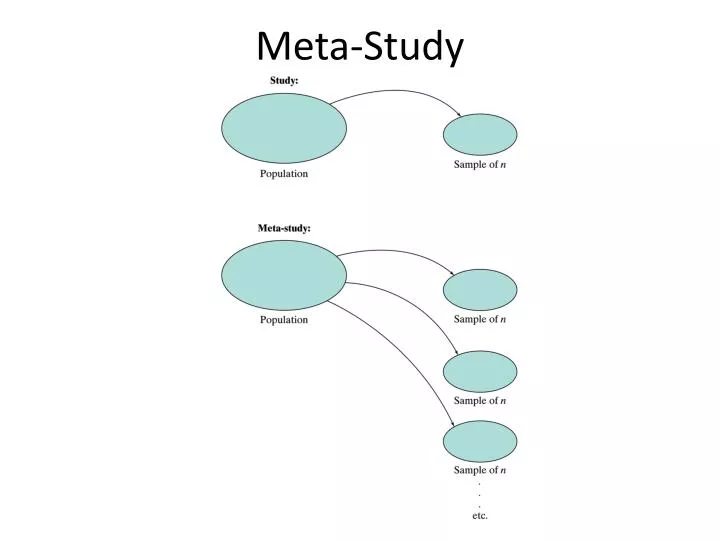
Meta-Study. Representation of the Sampling Distribution of Y̅. The Sampling Distribution of . Example: Sampling Distribution. In a certain population of fish, the lengths of individual fish follow a normal distribution with mean 54 mm and standard deviation 4.5 mm

E N D
Example: Sampling Distribution In a certain population of fish, the lengths of individual fish follow a normal distribution with mean 54 mm and standard deviation 4.5 mm a) What is the probability that a random chosen fish is between 51 and 60 mm long? b) Suppose we sample 4 fish, what is the probability that the mean length of the four fish is between 51 and 60 mm long?
Example 5.2.3: Sampling Distribution/Population Size This shows the sampling distribution for the samples of various sizes from a princess bean population (Example 5.2.2). Here the population mean is μ = 500 mg. (b)
Example: Continuity Correction This tableshows the distribution of litter size for a population of female mice with population mean 7.8 and SD 2.3.
Example: Continuity Correction(cont) Table 4.1 shows the distribution of litter size for a population of female mice with population mean 7.8 and SD 2.3.