Download
1 / 25
250 likes | 381 Views
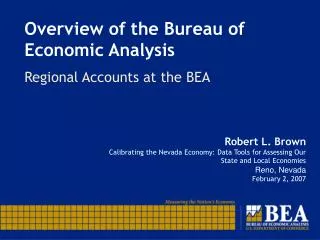
Overview of the Bureau of Economic Analysis. Regional Accounts at the BEA. Robert L. Brown Calibrating the Washington Economy: Data Tools for Assessing Our State and Local Economies Skagit Valley, Washington May 11, 2007. BEA Mission.

E N D
Overview of the Bureau of Economic Analysis Regional Accounts at the BEA Robert L. Brown Calibrating the Washington Economy: Data Tools for Assessing Our State and Local Economies Skagit Valley, Washington May 11, 2007
BEA Mission • To promote a better understanding of the U.S. economy by providing the most timely, relevant, and accurate economic accounts data in an objective and cost-effective manner • The nation’s economic accountant: comprehensive double-entry accounts and economics
What Do We Produce? • National Economic Accounts • Gross Domestic Product (GDP) • Personal Income • Price Measures • International Economic Accounts • International transactions • Direct investments • Operations of US and foreign multinational companies • Industry Accounts • Input-output accounts • GDP by industry • Travel and tourism satellite account
What do we produce? • Regional economic accounts • Gross domestic product (GDP) by state • Personal income for states and local areas • Regional economic multipliers
Gross Domestic Product (GDP) by State • Most comprehensive measure of overall state economic activity • State counterpart of the US GDP • GDP by State is the sum of • Compensation of employees • Gross operating surplus • Taxes on production and imports
Currently available GDP-by-State estimates • Annual data starting 1963 to 2005 • Total GDP by state and components by industry • Estimates in current dollars, chained (2000) dollars and quantity indexes • Derivation of real GDP by state: • apply national implicit price deflators to current-dollar GDP-by-state estimates for detailed industries
GDP by State release cycle • Total GDP by state and sector industry • 6 months after the end of year • Revised GDP by state by component and and subsector industry • 18 months after reference year • Based on more complete source data
Personal income • The most current, comprehensive and consistent measure available of household income • Comprehensive: measures income received by persons from • production (returns to labor and capital) • business and government transfers • Consistent across time and geography
Components of personal income • Earnings (Place of Residence) • Compensation (Place of Work) • Wages and salaries • Supplements • Employer payments for pensions and health insurance • Employer contributions for social insurance • Proprietors’ income (sole and partnerships) • Less: Contributions for social insurance • Plus: Adjustment for residence • Dividends, interest and rent (property income) • Government and business transfers • Including Social Security, UI, Medicare/Medicaid, workers’ compensation benefits
State personal income • Quarterly estimates by place of residence from 1948 • 3 months after the end of the quarter • Annual estimates by place of residence from 1929 • Preliminary 3 months after end of year • Detailed 9 months after the end of the year • Includes per capita and disposable personal income estimates • Annual earnings, compensation, and employment by industry by place of work
Local area personal income • Annual data from 1969 • Metro area PI now released 9 months after end of year • County PI released 16 months after end of year • Geographic availability: • 3,111 counties • 363 Metropolitan Areas • 576 Micropolitan Areas • 179 BEA Economic Areas • Earnings and employment by industry by place of work • Compensation by county and industry available 12 months after reference year
Uses of BEA’s regional income and product estimates • By the US Govt, to distribute over $215 billion in federal funds to states
BEA Regional Income & Product Accounts Estimates Used to Distribute $215 Billion in Federal Funds, FY 2005 [Funded Programs Are Shown in Millions of Dollars] Source: General Services Administration, Catalog of Federal Domestic Assistance, April 2006
Uses of BEA’s regional income and product estimates • By the US Govt, to distribute over $215 billion in federal funds to states • By the states, to develop state government revenue and expenditure estimates • Used in all states • 21 states have tax or spending limits tied to state personal income
Uses of BEA’s regional income and product estimates • By the US Govt, to distribute over $215 billion in federal funds to states • By the states, to develop state government revenue and expenditure estimates • 21 states have spending limits tied to state personal income • By business, to determine areas for new business location and expansion decisions
RIMS • Regional Input-Output Modeling System • Multipliers show impact of output change in any industries on 60 industry groups and the area total • Effects on output, employment, and labor earnings • User requests multipliers for any state, county or combination of areas • Customized product produced for a fee
Recent uses of RIMS multipliers • How military base closings affect local economies • Impact of a nuclear plant closure on Erie and Cattaraugus Counties, NY • The economic impact of Super Bowl XXXVII on the San Diego economy • The costs of Gulf oyster harvesting controls
Contact Information Robert L. Brown Chief, Regional Economic Measurement Division 202-606-9246 robert.brown@bea.gov