Download
1 / 3
40 likes | 230 Views
A. CYLV. MV-1. BYV. Closterovirus. GLRaV-2. CTV. RLMV. BVA. OLYaV. LIYV. SPCSV. Crinivirus. SPaV. CYSDV. PMWaV-1. GLRaV-5. Ampelovirus. PMWaV-2. GLRaV-1. GLRaV-3. B. PMWaV-2. GLRaV-3. Ampelovirus. GLRaV-1. PMWaV-1. GLRaV-5. SPCSV. Crinivirus. LIYV. SPaV. CYSDV.

E N D
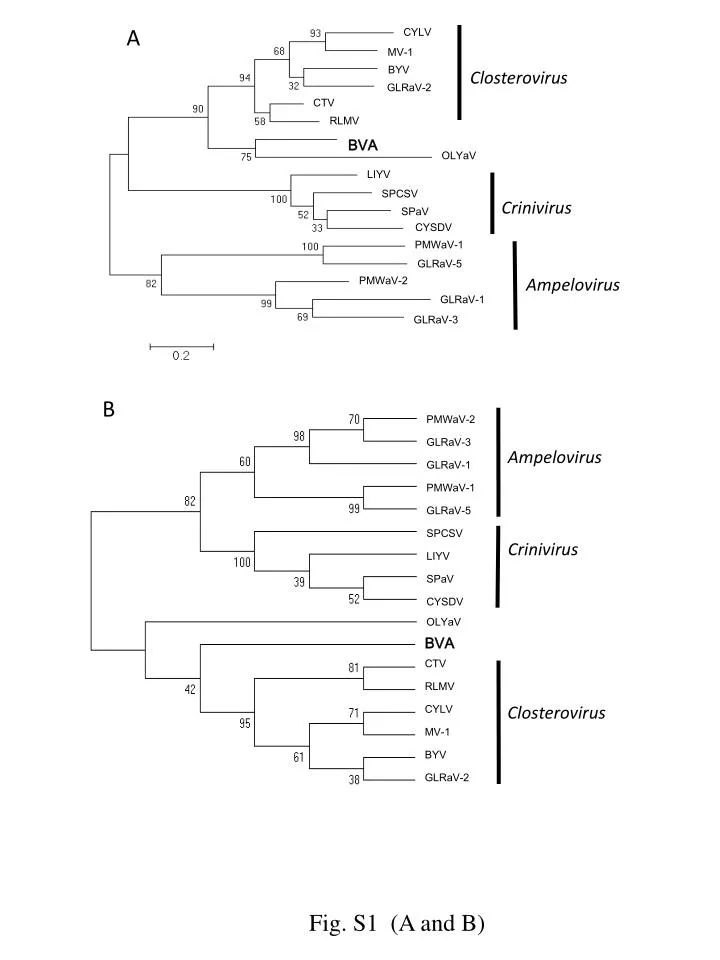
A CYLV MV-1 BYV Closterovirus GLRaV-2 CTV RLMV BVA OLYaV LIYV SPCSV Crinivirus SPaV CYSDV PMWaV-1 GLRaV-5 Ampelovirus PMWaV-2 GLRaV-1 GLRaV-3 B PMWaV-2 GLRaV-3 Ampelovirus GLRaV-1 PMWaV-1 GLRaV-5 SPCSV Crinivirus LIYV SPaV CYSDV OLYaV BVA CTV RLMV Closterovirus CYLV MV-1 BYV GLRaV-2 Fig. S1(Aand B)
GLRaV-3 C PMWaV-2 Ampelovirus GLRaV-1 PMWaV-1 GLRaV-5 LIYV CYSDV Crinivirus SPCSV SPaV BVA OLYaV BYV GLRaV-2 CYLV Closterovirus MV-1 CTV RLMV BYV D GLRaV-2 CTV Closterovirus RLMV CYLV MV-1 OLYaV PMWaV-1 GLRaV-5 Ampelovirus PMWaV-2 GLRaV-3 GLRaV-1 LIYV SPCSV Crinivirus SPaV CYSDV BVA Fig. S1(Cand D)
E PMWaV-2 GLRaV-1 Ampelovirus GLRaV-3 PMWaV-1 GLRaV-5 LIYV SPaV Crinivirus CYSDV SPCSV Closterovirus CTV BVA RLMV BYV Closterovirus GLRaV-2 CYLV MV-1 GLRaV-3 F PMWaV-2 Ampelovirus GLRaV-1 PMWaV-1 GLRaV-5 LIYV SPaV Crinivirus CYSDV SPCSV BYV GLRaV-2 CYLV Closterovirus MV-1 CTV RLMV BVA Fig. S1. Phylogenetic trees generated from amino acid sequence alignments of BVA and selected members of the family Closteroviridae. A and B show the maximum likelihood (ML) and maximum parsimony (MP) trees of RdRp, respectively (residues 107–292 of 1b protein). C and D show the ML and MP trees of HSP70h, respectively; residues 1–606). E and F show the ML and MP trees of CP, respectively (residues 1–215). Amino acid sequences were aligned with the Clustal W program (Thompson et al. 1994). MEGA software version 5.0 (Tamura et al. 2011) and the ML and MP methods with the default value and 1,000 bootstrap replicates were used for the phylogenetic analysis. For abbreviations and sequence accession numbers, see Table 1. Numbers above or below branches indicate bootstrap percentages from 1,000 repeats. The horizontal branch length of the ML trees represents residue substitutions per site.