Download
1 / 33
330 likes | 472 Views
Integration and Application of the TAU Performance System in Parallel Java Environments. Sameer Shende, Allen D. Malony {sameer,malony}@cs.uoregon.edu Computer & Information Science Department Computational Science Institute University of Oregon. Java HPC and Performance Technology.

E N D
Integration and Application of theTAU Performance System inParallel Java Environments Sameer Shende, Allen D. Malony {sameer,malony}@cs.uoregon.edu Computer & Information Science Department Computational Science Institute University of Oregon
Java HPC and Performance Technology • Interest in performance tools for Java HPC • Shared- and distributed-memory parallelism • Multi-level (semantic) performance views • Java environment challenges performance technology • Language and packages • object-oriented, interfaces, RMI, reflection, … • Java Virtual Machine (JVM) execution model • thread mapping, scheduling, SMP execution, event access • Just-In-Time (JIT) compilation and dynamic loading • Java Native Interface (JNI) • inter-language execution, non-Java events / execution • Portability of performance tools and methods
Research Problems • GeneralHow to create robust and ubiquitous performance technology for the analysis and tuning of parallel high-performance software and systems in the presence of (evolving) complexity challenges? • SpecificCan performance technology developed for use in HPC environments be successfully applied to parallel Java environments, and how are the new performance instrumentation, measurement, and analysis problems addressed?
Talk Outline • Java HPC and Performance Technology • TAU Performance System • Computation model for performance technology • TAU performance system toolkit • Target HPC Java Environment • SMP clusters and distributed computing • Multi-threading + MPI message passing • Integration (Adaption) of TAU Performance System • User-level, JVM-level, JNI-level, inter-language • Example “Mixed-Mode” Application • Conclusions
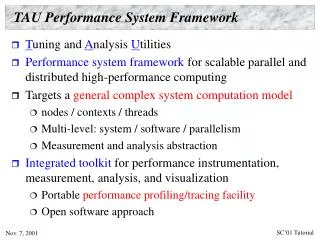
TAU Performance System • Tuning and Analysis Utilities • Performance system framework • scalable parallel and distributed HPC • Targets a general complex system computation model • nodes / contexts / threads • Multi-level: system / software / parallelism • Measurement and analysis abstraction • Integrated performance toolkit • instrumentation, measurement, analysis, visualization • Portable facility based on open software approach • Robust and widely applied
General Complex System Computation Model • Node:physically distinct shared memory machine • Message passing node interconnection network • Context: distinct virtual memory space within node • Thread: execution threads (user/system) in context Interconnection Network Inter-node messagecommunication * * Node Node Node node memory memory memory SMP physicalview VM space … modelview … Context Threads
Paraver EPILOG TAU Performance System Framework
Target HPC Java Environment • Hybrid, multi-language scientific applications • Java + {C, C++, Fortran} libraries • Numerical, system, communications support • Performance optimization • Mixed-mode parallelism • Multi-threaded shared memory parallelism • Distributed memory parallelism using communications • Cluster of SMP nodes • Scalable parallelism • Distributed
Performance Technology Issues • Object-oriented programming • Object-based performance analysis • High-level classes and performance mapping • Multi-level performance events • User / source / byte code / VM / OS / libraries / external • Multiple performance instrumentation strategies • Integration of performance measurements • Mixed-mode parallel computation • Multi-threading performance measurement • Cross-mode performance correspondence • Hybrid, multi-language performance measurement
Java Source-Level Instrumentation • TAU Java package • User-defined events • TAU.Profile class for new “timers” • Start/Stop • Performance data output at end
Java program TAU.Profile class (init, data, output) TAU package JNI C bindings JNI TAU as dynamic shared object TAU Profile database stored in JVM heap Profile DB TAU Java Source Instrumentation Architecture • Any code section can be measured • Portability • Measurement options • Profiling, tracing • Limitations • Source access only • Lack of thread information • Lack of node information
Multi-Threading Performance Measurement • General issues • Thread identity and per-thread data storage • Performance measurement support and synchronization • Fine-grained parallelism • different forms and levels of threading • greater need for efficient instrumentation • TAU general threading and measurement model • Common thread layer and measurement support • Interface to system specific libraries (reg, id, sync) • Target different thread systems with core functionality • Pthreads, Windows, Java, OpenMP
Virtual Machine Performance Instrumentation • Integrate performance system with VM • Captures robust performance data (e.g., thread events) • Maintain features of environment • portability, concurrency, extensibility, interoperation • Allow use in optimization methods • JVMProfiling Interface (JVMPI) • Generation of JVM events and hooks into JVM • Profiler agent (TAU) loaded as shared object • registers events of interest and address of callback routine • Access to information on dynamically loaded classes • No need to modify Java source, bytecode, or JVM
JVMPI Events • Method transition events • Memory events • Heap arena events • Garbage collection events • Class events • Global reference events • Monitor events • Monitor wait events • Thread events • Dump events • Virtual machine events
Thread API JNI TAU Profile DB TAU Java JVM Instrumentation Architecture • Robust set of events • Portability • Access to thread info • Measurement options • Limitations • Overhead • Many events • Event control • No user-defined events Java program Event notification JVMPI
Java Multi-Threading Performance (Test Case) • Profile and trace Java (JDK 1.2+) applications • Observe user-level and system-level threads • Observe events for different Java packages • /lang, /io, /awt, … • Test application • SciVis, NPAC, Syracuse University % ./configure -jdk=<dir_where_jdk_is_installed> % setenv LD_LIBRARY_PATH $LD_LIBRARY_PATH\:<taudir>/<arch>/lib % java -XrunTAU svserver
TAU Profiling of Java Application (SciVis) 24 threads of execution! Profile for eachJava thread Captures eventsfor different Javapackages
TAU Tracing of Java Application (SciVis) Performance groups Timeline display Parallelism view
Vampir Dynamic Call Tree View (SciVis) Per thread call tree Expandedcall tree Annotated performance
Message Communications Performance • Explicit message communications libraries for Java • MPI performance measurement • MPI profiling interface - link-time interposition library • TAU wrappers in native profiling interface library • Send/Receive events and communication statistics • mpiJava (Syracuse, JavaGrande, 1999) • Java wrapper package • JNI C bindings to MPI communication library • Dynamic shared object (libmpijava.so) loaded in JVM • prunjava calls mpirun to distribute program to nodes • Contrast to Java RMI-based schemes (MPJ, CCJ)
TAU package MPI profiling interface TAU TAU wrapper Native MPI library Native MPI library Profile DB TAU Java Instrumentation Architecture • No source instrumentation • Portability • Measurement options • Limitations • MPI events only • No mpiJava events • Node info only • No thread info Java program mpiJava package JNI
Mixed-mode Parallel Programs (Java + MPI) • Java threads and MPI communications • Shared-memory multi-threading events • Message communications events • Unified performance measurement and views • Integration of performance mechanisms • Integrated association of performance events • thread event and communication events • user-defined (source-level) performance events • JVM events • Support for performance measurement scaling • Support for performance data access
Instrumentation and Measurement Cooperation • Problem • JVMPI doesn’t see MPI events (e.g., rank (node)) • MPI profiling interfaces doesn’t see threads • Source instrumentation doesn’t see either! • Need cooperation between interfaces • MPI exposes rank, gets thread information • JVMPI exposes thread information, get rank • Source instrumentation gets both • Post-mortem matching of sends and receives • Selective instrumentation • java -XrunTAU:exclude=java/io,sun
Thread API TAU Java Instrumentation Architecture Java program mpiJava package TAU package JNI MPI profiling interface Event notification TAU TAU wrapper Native MPI library JVMPI Profile DB
Node 0 Node 1 Node 2 Parallel Java Game of Life (Profile) Merged Java and MPI event profiles • mpiJavatestcase • 4 nodes,28 threads Thread 4 executes all MPI routines
Integrated event tracing Mergedtrace viz Nodeprocessgrouping Threadmessagepairing Vampirdisplay Multi-level event grouping Parallel Java Game of Life (Trace)
Node / Thread Event Timeline • Temporal event behavior • Event relationships
Integrated Performance View (Callgraph) • Sourcelevel • MPIlevel • Javapackageslevel
Conclusion • Integrate robust and portable performance system (TAU) in Java HPC environment • Apply performance system to observe multiple levels of Java HPC operation • Leverage performance system framework based on common performance measurement API • Key: define multi-level events and define associations • Opportunities for improvement and application • JVM instrumentation and JIT (dynamic compilation) • Runtime access to performance data • Java scientific packages, communication libraries (CCJ, MPJ, RMI), // compilers (JOMP), applications, ..
More Information and Acknowledgments • URLs • TAU:www.cs.uoregon.edu/research/paracomp/tau • Grant support (TAU) • DOE 2000 ACTS • http://www-unix.mcs.anl.gov/DOE2000 • http://www.nersc.gov/ACTS • DOE ASCI Level 3 (LANL, LLNL) • DARPA
TAU Distributed Monitoring Framework • Extend usability of TAU performance analysis • Access TAU performance data during execution • Framework model • each application context is a performance data server • monitor agent thread is created within each context • client processes attach to agents and request data • server thread synchronization for data consistency • pull mode of interaction • Distributed TAU performance data space • “A Runtime Monitoring Framework for the TAU Profiling System” (ISCOPE ‘99)
TAU Distributed Monitor Architecture TAU profile database • Each context has a monitor agent • Client in separatethread directs agent • Pull model ofinteraction
Java Implementation of TAU Monitor • Motivations • More portable monitor middleware system (RMI) • More flexible and programmable server interface (JNI) • More robust client development (EJB, JDBC, Swing)