Download
1 / 17
170 likes | 418 Views
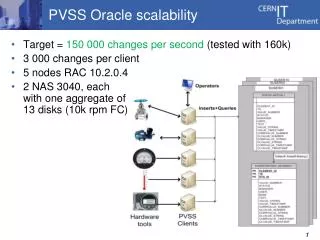
ROOT-PVSS Connection. Current Status. Introduction. Interface that allows PVSS data to be displayed using ROOT, permitting all analytical functions that are available in ROOT Motivation Features and implementation of the interface Examples – including demonstration Future plans. Motivation.

E N D
ROOT-PVSS Connection Current Status Slava Filimonov & Jim Cook, PVSS - ROOT Interface
Introduction Interface that allows PVSS data to be displayed using ROOT, permitting all analytical functions that are available in ROOT • Motivation • Features and implementation of the interface • Examples – including demonstration • Future plans Slava Filimonov & Jim Cook, PVSS - ROOT Interface
Motivation • Limited PVSS functionality • Zoom impractical • Histogramming difficult to use • Exclusively data from PVSS • No possibility to fit curve • NOTE: This has been and is being improved • Physicists familiar with ROOT • ROOT is a very powerful analysis tool • Possibility for parallel data sources • Multiple PVSS systems • Could include DAQ data, for example • This is not implemented in the current version Slava Filimonov & Jim Cook, PVSS - ROOT Interface
Basic features • Based on TCP/IP • Any number of ROOT clients can connect to one PVSS project • Trend Plots: • From a specified time in the past to present (updating) • From a time in past to another time in past (since--until) • Histograms • ROOT Macros can be used • No configuration necessary on PVSS side • Windows and Linux Slava Filimonov & Jim Cook, PVSS - ROOT Interface
GetArc Manager PVSS ROOT classes Viewer Macros ROOT - PVSS • Small API Manager (GetArc) • Only ~40 Kb Slava Filimonov & Jim Cook, PVSS - ROOT Interface
PVSS TCP Manager • Pass data point names or aliases using pattern (dpNames) • Take data for defined period and pass to a client (dpGetPeriod) • Send data on change (dpConnect) • Send single datapoint value (dpGet) • Currently limited to integer, float and boolean • Standard PVSS functionality used Slava Filimonov & Jim Cook, PVSS - ROOT Interface
Class Structure ‘Normal’ trend Histograph Retrieve single value Retrieve DP names with pattern Display data from start time to end time Trend with 2-dimensional ‘surface’ Display data from start time and update Slava Filimonov & Jim Cook, PVSS - ROOT Interface
Example: Two Graphs/Curves { // This script explains how the PVSS-ROOT class set is used gROOT->Reset(); gSystem.Load(“PVSSAccess.dll”); gBenchmark->Start("hclient"); ct = new TCanvas("ct","Time on axis",10,10,700,500); // Define Main Canvas TDatime start("2005-04-13 14:35:00"),end("2005-04-13 14:45:00"); // Define Time Interval char *dp = "ELMB/LaR/ELMB_1/AI/NTC_40.value"; // Data point name 1 char *dp1 = "ELMB/LaR/ELMB_1/AI/NTC_41.value"; // Data point name 2 time_t t = start.Convert(); // Convert to time_t format time_t e = end.Convert(); TPVSSAccess *sock = new TPVSSAccess("pcatics4.cern.ch",4242); // Connect to PVSS PVSSViews *pvss = new PVSSGraphViews(ct,"Test"); // Define View // Define two Graphs/Curves on one view/trend PVSSGraph *gr = new PVSSGraph(sock,dp, t,e,pvss); PVSSGraph *gr1 = new PVSSGraph(sock,dp1, t,e,pvss); pvss->insertTransaction(gr); pvss->insertTransaction(gr1); int rlen = sock->GetTimePeriod(gr); // Obtain data for first data point int rlen1 = sock->GetTimePeriod(gr1); // For the second pvss->drawTransaction(); gBenchmark->Show("hclient"); } Slava Filimonov & Jim Cook, PVSS - ROOT Interface
Example: 2D Graphs { gROOT->Reset(); gBenchmark->Start("hclient"); gSystem.Load("PVSSAccess.dll"); ct = new TCanvas("ct","Time on axis",10,10,700,500); // Main Canvas TDatime start("2005-04-12 9:00:00"),end("2005-04-12 11:00:00"); // Define Time Interval char **dpNames; char *dpw = "*Dubna_11?.Temperature.value"; // Data point using pattern char *dpt = ""; // Data point type int len, rlen; time_t t = start.Convert(); // Convert to time_t format time_t e = end.Convert(); TPVSSAccess *sock = new TPVSSAccess("pcephc613.cern.ch",4242); // Connect to PVSS int tr = sock->GetDpNames(dpw,dpt,len,&dpNames); // Get DP name from PVSS PVSSGraph2DViews *v = new PVSSGraph2DViews(ct,"Test"); // Open View v->SetOption("surf1"); for (int i = 0; i < len-3; i++) { // Open Trends cout << dpNames[i] << endl; PVSSGraph *gr = new PVSSGraph(sock,dpNames[i], t,e,v); rlen = sock->GetTimePeriod(gr); // Obtain data from data point } v->drawTransaction(); gBenchmark->Show("hclient"); } Slava Filimonov & Jim Cook, PVSS - ROOT Interface
2D Graph Display Slava Filimonov & Jim Cook, PVSS - ROOT Interface
Example: Trends { // This is an example to open trends gROOT->Reset(); gSystem.Load("PVSSAccess.dll"); gBenchmark->Start("hTrend"); ct = new TCanvas("ct","Time on axis",10,10,700,500); // Open canvas char **dpNames; char *dpw = "@NTC*"; // Data point alias pattern char *dpt = "FwElmbAi"; // Data point type int len; TPVSSAccess *sock = new TPVSSAccess("pcatics4.cern.ch",4242); // Connect to PVSS int rr = sock->GetDpNames(dpw,dpt,len,&dpNames); // Take DP name from PVSS PVSSGraphViews *v = new PVSSGraphViews(ct,"Test"); // Open View for (int i = 0; i < len; i++) { // Open Trends cout << dpNames[i] << endl; PVSSTrend *tr = new PVSSTrend(sock,dpNames[i],1800); v->insertTransaction(tr); sock->OpenTrend(tr); } v->startRefresh(5000); } Slava Filimonov & Jim Cook, PVSS - ROOT Interface
Example: Histogram { gROOT->Reset(); gSystem.Load("PVSSAccess.dll"); gBenchmark->Start("hclient"); TDatime start("2004-07-26 20:00:00"),end("2004-07-26 22:00:00"); char *dp = "ELMB/LaR/ELMB_1/AI/ai_0.value"; // DP name time_t t = start.Convert(); // Start interval time_t e = end.Convert(); // End Interval double *res,*dd; TPVSSAccess *sock = new TPVSSAccess("pcatics4.cern.ch",4242); // Connect to PVSS int len; int rlen = sock->GetTimePeriod(dp,t,e,len,res,dd); // Get Data ctt1 = new TCanvas("ctt1","Time on axis",10,10,700,500); gt = new TH1F("elmb_counts","This is ELMB counts distribution",100,61900,61950); for (int i = 0; i < len; i++) { gt.Fill(res[i]); // Fill Histogram } gt->SetTitle("ELMB/LaR/ELMB_1/AI/ai_5"); ctt1->SetFillColor(41); ctt1->SetFrameFillColor(33); gt->SetFillColor(19); gt->SetLineColor(5); gt->SetLineWidth(2); gt->Draw("AL"); gPad->Modified(); gBenchmark->Show("hclient"); } Slava Filimonov & Jim Cook, PVSS - ROOT Interface
Datapoint name and type selection (allowing use of pattern) Menu to allow connection to be set Datapoint names displayed here Time interval selection Data display area PPPViewer Slava Filimonov & Jim Cook, PVSS - ROOT Interface
Practical Remarks • Can be downloaded from: • http://atlas.web.cern.ch/Atlas/GROUPS/DAQTRIG/DCS/dcshome.html • Root installation – IMPORTANT • Developed with Version 4.03/02 • For Windows Visual Studio version • Delete LibNew • Install suitable .DLL (for Visual Studio version) • Full instructions on ROOT web site • Read them! • PVSS00GetArc Configuration [tcp] tcpServerSocket = 4242 Slava Filimonov & Jim Cook, PVSS - ROOT Interface
Future Plans • Manager • Convert aliases to data point names and vice versa • Extend data point types allowed when reading a single value • e.g. dyn_string • Viewer • Several pads in pppViewer • Save and Load selected datapoint list • Improve datapoint display and selection • Tree structure like Hardware or Logical View • Active X component • Can be displayed in PVSS panels • Configuration of display on PVSS side • PVSSAccess library • XY Graphs • Signal/Slot event • Would allow for a ‘trigger’ • Other data types (string, dyn_string,..) • More than one connection Slava Filimonov & Jim Cook, PVSS - ROOT Interface
Relation plots(value vs. value) Only one pair of values can be plotted at a time Slava Filimonov & Jim Cook, PVSS - ROOT Interface
To PVSS Time Start End Data Point name Request Header ROOT Data Timestamps Answer Header Answer Header Request Header Length Data Type Handler Command Handler Length Application Protocol Slava Filimonov & Jim Cook, PVSS - ROOT Interface