Download
1 / 26
260 likes | 374 Views
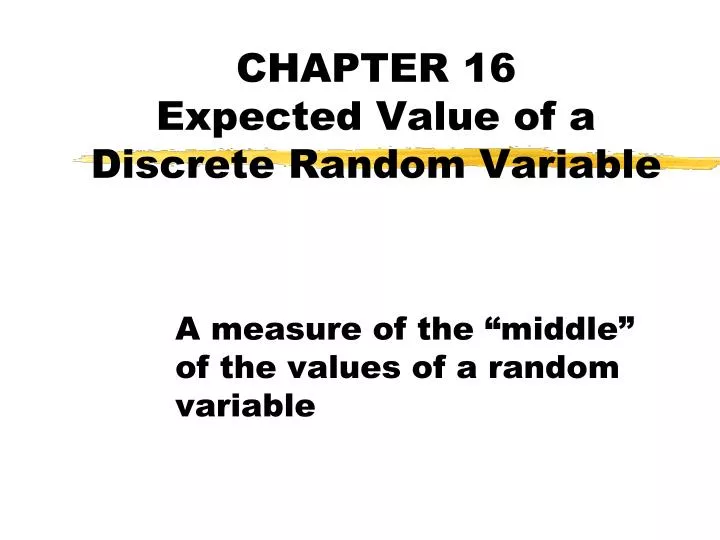
CHAPTER 16 Expected Value of a Discrete Random Variable. A measure of the “middle” of the values of a random variable. Center. The mean of the probability distribution is the expected value of X, denoted E(X) E(X) is also denoted by the Greek letter µ (mu). Economic Scenario. Profit

E N D
CHAPTER 16Expected Value of a Discrete Random Variable A measure of the “middle” of the values of a random variable
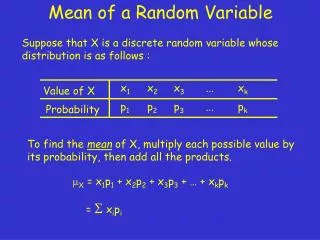
Center The mean of the probability distribution is the expected value of X, denoted E(X) E(X) is also denoted by the Greek letter µ (mu)
Economic Scenario Profit ($ Millions) Probability X P Great 10 0.20 x1 P(X=x1) 5 Good 0.40 x2 P(X=x2) OK 1 0.25 x3 P(X=x3) Lousy -4 0.15 x4 P(X=x4) Mean orExpectedValue k = the number of possible values (k=4) µ = x1·p(x1) + x2·p(x2) + x3·p(x3) + ... + xk·p(xk) Weighted mean
Mean orExpectedValue k = the number of outcomes (k=4) µ = x1·p(x1) + x2·p(x2) + x3·p(x3) + ... + xk·p(xk) Weighted mean Each outcome is weighted by its probability
Other Weighted Means • GPA A=4, B=3, C=2, D=1, F=0 • Stock Market: The Dow Jones Industrial Average • The “Dow” consists of 30 companies (the 30 companies in the “Dow” change periodically) • To compute the Dow Jones Industrial Average, a weight proportional to the company’s “size” is assigned to each company’s stock price
Economic Scenario Profit ($ Millions) Probability X P Great 10 0.20 x1 P(X=x1) 5 Good 0.40 x2 P(X=x2) OK 1 0.25 x3 P(X=x3) Lousy -4 0.15 x4 P(X=x4) Mean k = the number of outcomes (k=4) µ = x1·p(x1) + x2·p(x2) + x3·p(x3) + ... + xk·p(xk) EXAMPLE
Economic Scenario Profit ($ Millions) Probability X P Great 10 0.20 x1 P(X=x1) 5 Good 0.40 x2 P(X=x2) OK 1 0.25 x3 P(X=x3) Lousy -4 0.15 x4 P(X=x4) Mean k = the number of outcomes (k=4) µ = x1·p(x1) + x2·p(x2) + x3·p(x3) + ... + xk·p(xk) EXAMPLE µ = 10*.20 + 5*.40 + 1*.25 – 4*.15 = 3.65 ($ mil)
Mean k = the number of outcomes (k=4) µ = x1·p(x1) + x2·p(x2) + x3·p(x3) + ... + xk·p(xk) EXAMPLE µ = 10·.20 + 5·.40 + 1·.25 - 4·.15 = 3.65 ($ mil) µ=3.65
Interpretation • E(x) is not the value of the random variable x that you “expect” to observe if you perform the experiment once
Interpretation • E(x) is a “long run” average; if you perform the experiment many times and observe the random variable x each time, then the average x of these observed x-values will get closer to E(x) as you observe more and more values of the random variable x.
Example: Green Mountain Lottery • State of Vermont • choose 3 digits from 0 through 9; repeats allowed • win $500 x $0 $500 p(x) .999 .001 E(x)=$0(.999) + $500(.001) = $.50
Green Mountain Lottery (cont.) • E(x)=$.50 • On average, each ticket wins $.50. • Important for Vermont to know • E(x) is not necessarily a possible value of the random variable (values of x are $0 and $500)
Example: expected number of heads in 3 tosses of fair coin • Suppose a fair coin is tossed 3 times and we let x=the number of heads. Find m=E(x). • First we must find the probability distribution of x.
Example: expected number of heads in 3 tosses of fair coin (cont.) • Possible values of x: 0, 1, 2, 3. • p(1)? • An outcome where x = 1: THT • P(THT)? (½)(½)(½)=1/8 • How many ways can we get 1 head in 3 tosses? 3C1=3
Example: expected number of heads in 3 tosses of fair coin (cont.)
Example: expected number of heads in 3 tosses of fair coin (cont.) • So the probability distribution of x is: x 0 1 2 3 p(x) 1/8 3/8 3/8 1/8
Example: expected number of heads in 3 tosses of fair coin (cont.) • So the probability distribution of x is: x 0 1 2 3 p(x) 1/8 3/8 3/8 1/8
US Roulette Wheel and Table American Roulette 0 - 00(The European version has only one 0.) • The roulette wheel has alternating black and red slots numbered 1 through 36. • There are also 2 green slots numbered 0 and 00. • A bet on any one of the 38 numbers (1-36, 0, or 00) pays odds of 35:1; that is . . . • If you bet $1 on the winning number, you receive $36, so your winnings are $35
US Roulette Wheel: Expected Value of a $1 bet on a single number • Let x be your winnings resulting from a $1 bet on a single number; x has 2 possible values x -1 35 p(x) 37/38 1/38 • E(x)= -1(37/38)+35(1/38)= -.05 • So on average the house wins 5 cents on every such bet. A “fair” game would have E(x)=0. • The roulette wheels are spinning 24/7, winning big $$ for the house, resulting in …
Expected Value, Surprise Onside Kicks • http://www.advancednflstats.com/ The change in expected points for the kicking team: successful 1.9; fail -1.4. • X=change in expected points for kicking team when attempting surprise onside kick • What values of p make surprise onside kicks a good strategy?
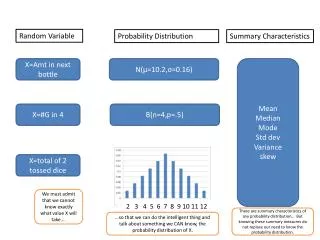
Two More Examples • X = # of games played in a randomly selected World Series Possible values of X are x=4, 5, 6, 7 • Y=score on 13th hole (par 5) at Augusta National golf course for a randomly selected golfer on day 1 of 2011 Masters y=3, 4, 5, 6, 7
Probability Distribution Of Number of Games Played in Randomly Selected World Series • Estimate based on results from 1946 to 2010. Probability Histogram
Probability Distribution Of Score on 13th hole (par 5) at Augusta National Golf Course on Day 1 of 2011 Masters Probability Histogram
Mean orExpectedValue E(X)= µ =4(0.185)+5(0.185)+6(0.215)+7(0.414) =5.86 games E(Y)= µ=3(.04)+4(0.414)+5(0.465)+6(0.051)+7(0.03) =4.617 strokes
Mean or Expected Value E(X)= µ =4(0.185)+5(0.185)+6(0.215)+7(0.414) =5.86 games µ=5.86