Download
1 / 15
150 likes | 300 Views
MST Inquiry Unit Plants and Animals. By Maryam, Jonathan, and Arielle. The Circle of Life lesson summary.

E N D
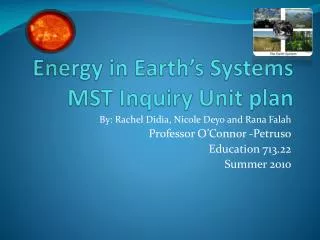
MST Inquiry UnitPlants and Animals By Maryam, Jonathan, and Arielle
The Circle of Life lesson summary • In order to understand plants and how the air, water and sun are involved in plants manufacturing food, students will be given plants in order to assess what kinds of differences and variables are involved in growing plant species, and develop a draft to be used for Microsoft Excel. After watching an informative video they will then fill out a scavenger hunt sheet in order to understand the terms and processes involved in photosynthesis, then come together and share their findings on what they have learned.
Lesson Standards • Blooms Taxonomy: Application, Analysis, and Knowledge • Garners Multiple intelligences: naturalistic, spatial, linguistic, interpersonal • NYC Science Scope & Sequence • Inquiry skills (2): Interpreting Data- Analyzing data that have been obtained and organized by determining apparent patterns or relationships in the data. • Creating models -Displaying information, using multisensory representations. • Process skills (2): xiii. Observe, analyze, and report observations of objects and events. xx. Compare and contrast organisms/objects/events in the living and physical environments • NCTM Math Skills • Process standards- Recognize and apply mathematics in contexts outside of mathematics. • Content Standards- sort and classify objects according to their attributes and organize data about the objects • ISTE Net Standards For Literate Students: List standard (s) Creativity and innovation 2(d) Contribute to project teams to produce original works or solve problems. Research and information fluency 3(b) Locate, organize, analyze, evaluate, synthesize, and ethically use information from a variety of sources and media.
Procedure • Students are placed into groups of 3 (though if there is an even number of students in the class, 4 students per group) and assemble a K-W-L chart about plants, completing it after reading the text and watching an informative video http://www.youtube.com/watch?v=zPqnYYI2Uq8 • After watching it, each group will receive plants (each group receiving one species of plant out of seed plants, flowers, and herbs) and record its length, then finding out the other lengths of the same plant from other groups to make a data chart showing growth. A rough draft of their graph is made on graph paper and students use Microsoft Excel to put the graph in a program after a demonstration. • With the spreadsheet they just created they will design a line graph for a longitudinal representation displaying their results about growth. • Students will then fill out a web based scavenger hunt for more information.
Scavenger Hunt • 1) What is the tallest plant that exists? • 2) What is the smallest plant that exists? • 3) Name three species of poisonous plants. • 4) What is a definition for a carnivorous plant? Include one example of it as well. • 5) List one product that comes from plants. • 6) What is the definition of an invasive plant? • 7) What kinds of plants live in the desert? List three. • 8) What are three plants that live in the ocean? • 9) What is the definition of a weed? • 10) What is the definition of a parasitic plant and an example of one?
Competition For Resources Summary • In order for students to become familiar with identifying competition for resources they must be aware that in any biological community, there may be several things in short supply for the organisms. We call these things resources, and the struggle to obtain them is competition. Students will be asked to fill out a KWL chart. Once that is complete, students will hear the story “Squirrel seeks Chipmunk” by David Sedaris. After the read aloud the students will finish the chart. Once that is complete they will fill out a Venn diagram in excel. Students will construct different types of creative graphs and then display them to their classmates.
Lesson Standards • Blooms’s Taxonomy: Application, Evaluation, Comprehension, and Knowledge • Gardner’s Multiple Intelligence: Visual/spatial, logical/ mathematical • Children’s Literature- Squirrel seeks Chipmunk by David Sedaris • NYC Science Scope & Sequence • Inquiry skills: Gathering and organizing data, creating models communication • Process skills: Classify and group objects • NCTM Math Skills • Process standards- Use mathematical models to represent and understand quantitative relationships, formulate questions that can be addressed with data, display relevant data to answer them. • Content Standards- Multiplicative thinking, equivalence • ISTE Net Standards For Literate Students • List standard (s)- Creativity and innovation, communication and collaboration, solve problems, use technology, research and information, evaluate.
Procedure • Students will be handed a K-W-L chart and placed into groups. Working in a group can combine all of their knowledge together and it can help those who are struggling to fill out the chart. • Next the class will watch a video about competition and predation. While they are watching they are to write down notes. • https://www.youtube.com/watch?v=D1aRSeT-mQE • After watching the clip the students will have a read aloud. • Next after the read aloud is complete the students will fill out the last section of the KWL chart and compete Venn diagram of squirrels and chipmunks. • Then, students will be shown a photo on a tumblr blog http://namibiawesome.tumblr.com/) to count how many animals of each species are present and create both a bar or pie chart out of it on Excel, showing them how much does each count for in percentages (5/11 = 45% rounded and 6/11 = 55%rounded)
Venn Diagram & Photo & Filamentality *Burrowing mammals *Both store foods http://www.kn.att.com/wired/fil/pages/listanimalsja.html