Download
1 / 15
150 likes | 326 Views
Parallelizing Graph Algorithms -Extending SSCA Benchmark-. CS315a Final Project Syed Akbar Mehdi Seok-Won Seong. Project Goals. Extend/Contribute to SSCA benchmark Parallel scale-free graph generation algorithm based on Barabasi -Albert ( OpenMP )

E N D
Parallelizing Graph Algorithms-Extending SSCA Benchmark- CS315a Final Project Syed Akbar Mehdi Seok-Won Seong
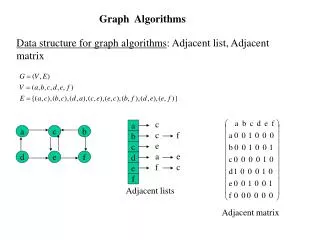
Project Goals • Extend/Contribute to SSCA benchmark • Parallel scale-free graph generation algorithm based on Barabasi-Albert (OpenMP) • Parallel cluster coefficient calculation algorithm • Evaluate the new algorithms • Performance on CMP architecture (niagara and hotbox) and compare with results from Cluster MP version. • Compare with the exiting SSCA implementations
Graph Generation: Barabasi-Albert Preferential Attachment • Self-organizing and scale-free • P(k) ~ k^(-γ) where k is the degree of vertex (power-law tail) • Real world examples • Proteins/genes, WWW, social network, citation, power grid • γactor ≈ 2.3, γwww ≈ 2.1, γpower ≈ 4, γcite ≈ 3 • Two key aspects of real networks • Growth: N not fixed • Preferential connectivity: Higher probability to vertex with larger connection • Comparisons: • Kronecker: Higher degree of parallelism but the structure of resulting graph heavily depends on the initial graph • B & A: Lesser degree of parallelism but still fast and parallelizable, preferential attachment, better configurable for desirable size and properties, better representation of social/random networks
BA & KR Comparison • Kronecker • Source: Scalable Modeling of Real Graphs using Kronecker Multiplication J. Leskovec and C. Faloutsos, ACM International Conference Proceeding Series; Vol. 227 • Barabasi-Albert • Source: Social Simulation of Stock Markets: Taking It to the Next Level, A. O. I. Hoffmann, W. Jager and J. H. Von Eije, Journal of Artificial Societies and Social Simulation vol. 10, no. 2, 7
High Level Parallel BA Algorithm Initialization Loop Setup Preferential Weight Normalization Edge Creation Based on Pref Weight Generation Finalization • Input: # of V (N), # of E (M), max W, growth factor [0,1] • Output: weighted directed graph (|V|, |E|) • Parallelism : task-driven, master thread, synchronization with barriers & locks • Normalizing vertex preferential weight • Creating M/Iteration edges for N/Iteration vertices • Generating M edge weights • Fine-grain locking per vertex • Minimal contention but overheads • Possible to completely eliminate • More optimization & configuration to explore
BA vs KR on hotbox (time) 1K (2^10) Vertices and 8K Edges 64K (2^16) Vertices and 1/2M Edges Execution Time vs # of Processors
Preliminary Results (speedup) Speedup vs # of Processors
Parallel Clustering Coefficient Calculation The clustering coefficient of a vertex in a graph quantifies how close the vertex and its neighbors are to being a clique (complete graph). Goal is to calculate clustering coefficient for each node in a very large graph. Simple parallel algorithm that can be used is to divide up the vertices into chunks and assign to each processor. Goal is to study the scalability of the algorithm on shared memory machines. Average of the Clustering Coefficient can help identify if the graph is a small-world network.
Clustering Coefficient on Directed Graphs • In a directed graph G = (V,E) with a vertex vi having ki total out-edges and in-edges, the clustering coefficient is defined as: • Where • For the given benchmark suite, graphs are represented as out-edge lists. • For each vertex the edge array contains all the out-edges from each vertex. • Another array indexed by vertex number indexes into the edge array to give the starting and ending locations of each vertex’s edges. • In order to calculate the clustering coefficient we need to generate an in-edge array, while running the algorithm. • We will calculate the in-edge list and store is as an adjacency list during the first phase of the algorithm. • Locking done per list for a particular vertex.
Algorithm • Divide up the out-edge array, equally among the total number of threads. • Division is done in SPMD manner with each thread accessing its part by offsetting into the array using its TID. • Declare array links[n], where n is the number of vertices and adjacency list Adj of size n, where Adj[i] points to in-adjacency list of vertex i. • PARALLEL BLOCK • For each vertex vi in this threads portion of the out-edge array. • For each out-edge neighbor Vk of vertex Vi • Compare the out-vertex lists of Vk and Vi and increment links[Vi] for each match. b. Acquire lock on Adj[k], and insert Vi into the list • For each vertex vi in thread’s portion of the in-edge list. • For each out-edge and in-edge neighbor Vk of vertex Vi • Compare the out-vertex lists of Vk and Vi and increment links[Vi] for each match • Repeat step 2 and increment links[vi] for all out-edges from out-neighbours of vi to in-neighbours of vi • Calculate clustering coefficient for all vertices in this threads portion using the links value calculate above.
Further Analysis We plan to further analyze the following for the project report: Effect of changing the parameters of the preferential attachment graph generation algorithm on calculation of clustering coefficient. Load imbalance? How to resolve it? Analyzing and understanding the memory and synchronization patterns/overhead of the algorithm on a simulator.
Reference [1] Techniques for Designing Efficient Parallel Graph Algorithms for SMPs and Multicore Processors. (Guojing Cong and David A. Bader) [2] HPCS Scalable Synthetic Compact Applications #2 Graph Analysis (http://www.graphanalysis.org/benchmark/HPCS-SSCA2_Graph-Theory_v2.2.pdf) [3] Barabási, A.-L. and R. Albert (1999). "Emergence of scaling in random networks". Science 286: 509-512. http://arxiv.org/abs/cond-mat/9910332. [4] Andy Yoo and Keith Henderson, “Parallel Generation of Massive Scale-Free Graphs”, SC’06.