Download
1 / 13
130 likes | 256 Views
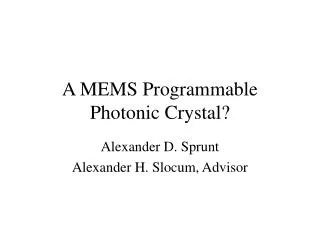
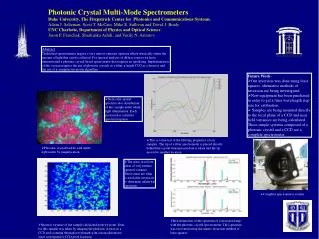
Near Field Photonic Crystal Multi-Mode Spectrometer. Adam Saltzman 4/19/02 BME 265 Dr. J Izatt Collaborators: Vasily Astratov UNC Chalet, Scott McCain, Michael Sullivan, David Brady Duke University. Multi Mode Spectrometer What are they and why are they superior.

E N D
Near Field Photonic Crystal Multi-Mode Spectrometer Adam Saltzman 4/19/02 BME 265 Dr. J Izatt Collaborators: Vasily Astratov UNC Chalet, Scott McCain, Michael Sullivan, David Brady Duke University www.disp.duke.edu
Multi Mode SpectrometerWhat are they and why are they superior A traditional spectrometer the ocean optics USB 2000 Note two things first this product is small compact and Easily interfaced. To compete in this market you needto push past such well established standardsSecond its input is a 50 Micron fiber. This fiber aperture Defines the resolution of the spectrometer. In this Spectrometer light comes threw the small input aperture And is splayed across a CCD using a grating. The wider The input light means the more overlap from different sections of the grating. In short this means that the Only light it can analyze is light coupled into this fiber. A multi mode Spectrometer is a spectrometer that can detect the average spectrum of many incoming modes of light. www.disp.duke.edu
Multi Mode Spectrometer This Spectrometer design is simple requiring only The size of your smallest CCD for implementation. Implementation requires you to mount a irregular Photonic crystal directly to the front face of the CCD And the difficulty of the spectrometer is all a matrix Inversion problem Note that the input aperture of this spectrometer Is the entire face of a CCD. As long as you can Get a photonic crystal with diverse spectral Properties you can create a spectrometer. The Resolution of your spectrometer is limited by the Resolution of your camera and the quality of your Crystal not by the size of your input aperture www.disp.duke.edu
What is a Non-uniform Photonic Crystal This is a picture of one of our photonic crystals as seen with white light illumination And 5X magnification. The different regions of color are well ordered segments within a larger photonic structure. The entire crystal is formed of silica micro spheres slowly gravity settled in a fluid bath. The interesting domain properties occur when this bath is brought supercriticaly to vapor and the domains collapse in on themselves. The result is the small domains that you see here. www.disp.duke.edu
Calibration and forming a spectrometer This is the calibration step for the monochrometer. The photonic crystal is mounted directly to the face of the CCD, under the cover glass. Pictures are taken while being illuminated with monochromatic light. Note: Because the intensity of the light varies with wavelength and the response of the CCD varies with wavelength Pictures need to be taken before the photonic crystal is mounted in order to subtract off a background. Tube to limit stray light Monochrometer Slit Output on Edges Electrimcamera Condensing Lens Oriellight Source www.disp.duke.edu
Spectral Variance of Near Field Electrim and Imaged Cool Snap Setups Variance taken using new background technique and Electrim camera. Electrim is a 10 bit uncooled camera with a low dynamic range. Variance of photonic crystal, photos taken with imaging lens and the Cool snap camera. The Cool snap is a 16bit cooled camera with high dynamic range. www.disp.duke.edu
Difficulties With Poor VarianceProblems to be Overcome • Because of the Poor resolution of the images and the low dynamic range of the camera Much of the relevant data was lost. The Dynamic range problem can be overcome by taking different background and crystal images at different exposure times for different wavelengths. Although this is possible for a successful spectrometer this is unreasonable and time consuming it requires multiple steps to a already complicated calibration process. The resolution issue can only be corrected by using a higher quality CCD. • Because of the poor quality of this spectral variance map an inversion is not possible, But I have completed the code and formatted it in a fashion that will make inversion of this data take moments I will outline the inversion process and give examples of past data from the older system which shows real goals. www.disp.duke.edu
Inversion Process • Once the calibration photos are taken and a spectral variance map computed its necessary to compute a transfer function for this system. In the simplest mathematical formulation. • Input*Transfer=Output • We know the output response to each wavelength. So to find the transfer function we multiply the system by the inverse of the input function Input-1*Input*Transfer=Output*Input-1 Therefore Transfer=Output*Input-1 • This is a tensor of values a different value for each of the computed inputs www.disp.duke.edu
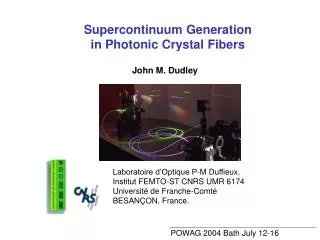
Inversion Process Continued • We know from above that out Input*Transfer=Output and we know are transfer function • So are input=Output*Transfer-1 From this simple reconstruction you can reproduce the input signal of any unknown Source. The image to your left is an example of mean centered and Non mean centered reconstructions of a similar photonic crystal in the previous incarnation of this spectrometer. The red line is the actual visible signature of neon and the blue boxes are a 2nm resolution reconstruction. I had hoped for results of at least this caliber with significantly less difficulty. www.disp.duke.edu
Advantages of New System • The new design for the spectrometer is mobile and complete. It is small compact and set. • Previous designs required a imaging system which required a telescoping lens to image the photonic crystal onto the CCD. • This old design is sensitive to the slightest motion between camera and crystal. • Additional Problems with the old design include focusing on multiple planes within the crystal and extreme sensitivity to stray light www.disp.duke.edu
More Advantages • This new design by mounting the crystal directly onto the CCD eliminates many of the initial problems. • The simplicity of the design requires no lenses or apertures there is never any issue with focusing on the crystal or moving the sample. The crystal functionally becomes part of the CCD. • Also because the sample is directly on the plane of the CCD it is difficult for stray light to impinge between the camera and the photonic crystal this makes the system much more robust to environmental conditions www.disp.duke.edu
Difficulties • Because of the nature of the experiment I was forced to chose a CCD that I could remove the cover plate from and subsequently glue samples to. This required multiple CCD arrays and an accessible camera. Since CCD’s are prohibitively expensive and camera assemblies are not normally accessible this may be as far as this camera can go. • Some simple changes that can be made in my procedure is to cut the calibration process into multiple small sections. Keeping track of the background in these small sections will enable me to overcome the dynamic range difficulties of this system. • Also perhaps attaching a different thicker photonic crystal will increase the spectral variance of the sample and also allow me to up the integration time stabilizing the image. www.disp.duke.edu
Side Notes • The pictures taken with the camera show values and are far from the same. The picture on the right is the background subtracted image at 500nm the one on the left is the background subtracted image at 600nm. There is some hope for this that possibly by compensating for the poor dynamic range of this camera I will be able to create a successful inversion www.disp.duke.edu