Download
1 / 32
320 likes | 455 Views
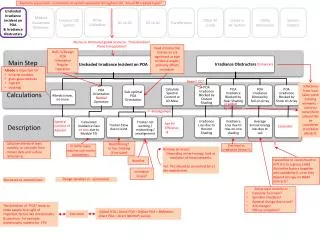
Defining and Measuring Student Success Dr . Mary Morley, Director of Institutional Research, Ocean County College John Pidgeon, Director of Institutional Research, Gloucester County College Dr . Tim Coley, Senior Strategic Consultant, Ellucian. Presentation Description.

E N D
Defining and Measuring Student SuccessDr. Mary Morley, Director of Institutional Research, Ocean County CollegeJohn Pidgeon, Director of Institutional Research, Gloucester County CollegeDr. Tim Coley, Senior Strategic Consultant, Ellucian
Presentation Description The community colleges in New Jersey have been collecting large amounts of data on student success by following the 2008 student cohort. The panel will discuss what data was collected, why that data was selected, what constitutes success, what factors might correlate with success, and how the results can be used to improve student success.
Presentation Agenda 1) Background on Community College Student Success – Tim Coley 2) The New Jersey 2008 Student Success Model and Preliminary Results – John Pidgeon 3) Success Models for Community Colleges in New Jersey and Defining Success – John Pidgeon and Mary Morley 4) Using Data from the Model to Make Improvements – Mary Morley The data charts for the New Jersey Student Success Model were adapted from a presentation by Linda Lam of the New Jersey Council of County Colleges.
Information Resources • ACT Reports • CCCSE: Center for Community College Student Engagement Reports • CCSSE: Community College Survey of Student Engagement • SENSE: Survey of Entering Student Engagement • IPEDS: Integrated Postsecondary Education Data System • Achieving the Dream Initiative • SAM: Student Achievement Measure • Voluntary Framework of Accountability, American Association of Community Colleges
First- to Second-Year Retention 55.0 51.4 (2004) 55.7 (2010)
Persistence to Degree 22.5 38.8 (1989) 22.5 (2013)
Center for Community College Student Engagement Community College Survey of Student Engagement (CCSSE) Report • Almost half (45%) of students have never discussed an idea from their classes with an instructor outside of class
Center for Community College Student Engagement Community College Survey of Student Engagement (CCSSE) Report • Half (51%) of students rarely or never use career counseling services
Student Achievement Measure The Student Achievement Measure (SAM) provides an improved way to report student progress and graduation by including a greater proportion of an institution’s undergraduate students as well as tracking students who enroll in multiple higher education institutions. Usual measures of student progress and completion, including government-led efforts, usually underreport student achievement because they do not account for an increasingly mobile student population. The associate’s and certificate program model will report on (1) full-time students attending the reporting institution for the first time and (2) part-time students attending the reporting institution for the first time
Developing Your Model High School Academic Demographic Early college academics Early college activities Non-cognitive
2) The New Jersey 2008 Student Success Model and Preliminary Results
Background In FY2009, the Council of County Colleges worked with the campus institutional research (IR) officers to develop a new student success model for consideration by New Jersey’s community college presidents. The IR directors reviewed various existing and up and coming models including the Federal Graduation Rate Survey (GRS) Method, the Lumina Foundation’s “Achieving the Dream Project” (ATD), and the ACCT’s “Voluntary Framework of Accountability” (VFA). Based on this research, the IR directors recommended a New Jersey model to measure student success. The New Jersey Student Success Model was developed to examine graduation, transfer, and degree credit attainment for all first-time, full- and part-time, degree-seeking students over a six-year timeframe. The New Jersey Student Success Model was approved by the presidents in June of 2009.
The New Jersey Success Model • In order to evaluate this model, the IR officers collected data on all first-time, full- and part-time, degree-seeking students entering in fall 2002 and determined their success after six years. • The student success rate for these students is a composite measure, consisting of three distinct sub-measures. These measures include: • those who have earned a degree or certificate, • those who have transferred to a four-year institution without receiving an award, and • those who have earned 30 degree credits with a GPA of 2.0 or better. • Using this model, NJ’s community colleges had an overall student success rate of 47 percent.
The Original Model for Student Success Students All First-Time, Full- and Part-Time, Degree-Seeking Freshmen, Fall 2002 29,436 Enrollment Status Full- and Part-Time Full-Time Part-Time 20,789 8,647 Time Frame Six Years Success Outcomes Earned a Degree/Certificate 5,926 20% 4,897 1,029 Full-Time Part-Time Transferred without Award 4,153 14% Full-Time Part-Time 3,182 971 Earned 30 Degree Credits with GPA of 2.0 or higher 3,804 13% Full-Time Part-Time 2,734 1,070 Total of Above 13,883 47% Full-Time Part-Time 10,813 3,070
3) Success Models for Community Colleges in New Jersey and Defining Success
The Big Ideas Project • This model still left the community college sector with further questions regarding student success as it embarked on the Big Ideas project, such as: • Why do so many students fail to achieve one of the three measures of success? • What is happening to those students that begin by taking developmental education courses? • What barriers exist to student success? • These questions led the Big Ideas Team #3 to recommend a more comprehensive student success model that disaggregates success measures by: • Students who enter community college prepared for college level work • Students who require developmental education • Students who require English as a second language (ESL) • Eight colleges volunteered to pilot the revised student success model starting with the fall 2008 cohort of entering students; measures of success will be calculated after three and six years.
New Jersey’s Revised Model for Student Success Aggregated Results of Fall 2008 Cohort after Three Years – Four Pilot Schools All First-Time, Full- and Part-Time, Degree-Seeking Freshmen, Fall 2008 9,165 Students College Ready Developmental ESL Others 2,158 23.5% 6,582 71.8% 213 2.3% 212 2.3% Preparedness Time Frame (Three Years)and Six Years Success Outcomes Earned a Degree/Certificate 20.7% College Ready Developmental ESL Others 40.3% 15.4% 1.4% 5.7% 13.5% Transferred without Award College Ready Developmental ESL Others 16.4% 12.7% 2.8% 19.8% Earned 30 Degree Credits with GPA of 2.0 or higher 17.5% College Ready Developmental ESL Others 16.8% 18.1% 19.7% 5.2% 51.7% Total of Above College Ready Developmental ESL Others 73.4% 46.1% 23.9% 30.7%
New Jersey’s Revised Model for Student Success Aggregated Results of Fall 2008 Full-time Cohort after Three Years – 16 Schools All First-Time, Full--Time, Degree-Seeking Freshmen, Fall 2008 26,346 Students College Ready Developmental ESL Others 4,454 16.9% 19,329 73.4% 1,901 7.2% 662 2.5% Preparedness Time Frame (Three Years) Success Outcomes Earned a Degree/Certificate 18.0% College Ready Developmental ESL Others 40.0% 14.2% 3.8% 22.2% 12.8% Transferred without Award College Ready Developmental ESL Others 16.8% 12.3% 5.8% 20.2% Earned 30 Degree Credits with GPA of 2.0 or higher 20.1% College Ready Developmental ESL Others 16.8% 18.1% 19.7% 5.2% 51.0% Total of Above College Ready Developmental ESL Others 76.0% 47.3% 27.2% 58.3%
Full Success Model What constitutes a success? Graduation? Retention? Completing remedial? Progressing to college level course work? Completing ESL?
Full Success Model 146 Data Elements, including: Demographic Information Placement Scores Student Success Courses Remedial Completion Passed College-level English and/or Math Courses Completed degree credits in 1 year, 2 years, 3 years ...
Next Steps • Additionally, the Team recommended that the IR officers create a common data collection process with operational definitions that align with emerging national models of student success including Lumina’s “Achieving the Dream,” and the ACCT’s “Voluntary Framework of Accountability.” • Establish a student success data collection mechanism so that each college can: • Track students by their entering level of preparedness (College Ready, Developmental, ESL, Others) semester by semester, • Track students by their progress through developmental courses into college level courses semester by semester, • Track student progress by student demographics (gender, race, age, program, financial aid status), and • Track students beyond successful completion at the community colleges (at four-year institutions, employment, etc.).
Some observations from examining OCC’s dataThe full success model is a very useful tool for examining what contributes to success
The First Semester Is Important • A student’s chance of passing a remedial course is highest their first semester of college • The summer before may be even better • Students placing in the lowest level remedial for both Math and English have significantly higher retention if they take a Student Success course their first semester – and this advantage continues into their fourth semester
Persistence Is important Part-time Students who attend consistently (fall and spring) for 3 years at OCC had a success rate of 71% – almost as high as the state-wide figure for full-time students who were college-ready (76%)
Danger Signals • Withdrawing from the Lowest Level English Remedial course during a student’s first semester of college is highly correlated with failure • Withdrawing from a Student Success course during a student’s first semester of colleges is also correlated with failure
Next Steps for NJ Community Colleges • This spring we will start looking at the combined complete model for 16 of the community colleges