Download
1 / 34
450 likes | 1.26k Views
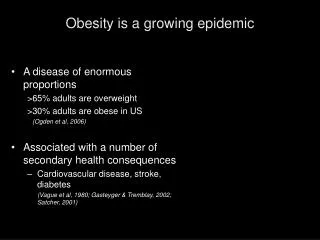
Assessment of the Obesity Epidemic. Obese (BMI ≥ 30) Overweight (BMI 25 - 29.9). More than 60% of US Adults Are Overweight. Flegal K, et al. JAMA 2002;288:1723-1727. Hedley AA, et al. JAMA 2004;291:2847-2850. Assessing Obesity: What Is BMI?. BMI

E N D
Obese (BMI ≥ 30) Overweight (BMI 25 - 29.9) More than 60% of US Adults Are Overweight Flegal K, et al. JAMA 2002;288:1723-1727. Hedley AA, et al. JAMA 2004;291:2847-2850.
Assessing Obesity: What Is BMI? • BMI • Calculated as weight(kg)/height(m2) • Evaluatesweight relative to height • Replaced % ideal body weight as the primary criterion for assessing obesity • Correlates significantly with body fat, morbidity, and mortality NIH Natl Heart, Lung, and Blood Inst. Obes Res. 1998;6(suppl 2):51S. Willett WC et al. N Engl J Med. 1999;341:427.
Prevalence of Obesity by Age Men Women Flegal et al. JAMA 2002;288:1723-1727.
Obesity Trends by Gender and Ethnicity Men Women Flegal K, et al. JAMA 2002;288:1723-1727.
Income 28 27.50 27.00 27 26.50 26 26.00 No High School Lowest Income HighSchool 25.50 AverageBMI 25 AverageBMI Some College Highest Income 25.00 24 24.50 College 24.00 23 23.50 22 23.00 1986 1988 1990 1992 1994 1996 1998 2000 2002 1986 1988 1990 1992 1994 1996 1998 2000 2002 Year Year Prevalence of Obesity by Education and Income Education Flegal et al. JAMA 2002;288:1723-1727.
Prevalence of Extreme Obesity (BMI ≥ 40) by Gender and Ethnicity Men Women Hedley AA, et al. JAMA 2004;291:2847-2850.
Prevalence of Overweight in Children and Adolescents Flegal K, et al. JAMA 2002;288:1723-1727. Hedley AA, et al. JAMA 2004;291:2847-2850.
Obesity and Coronary Heart Disease (CHD) Coronary Heart Disease Morbiditymortality Morbiditymortality Morbiditymortality Hypertension Diabetes Dyslipidemia 80% are obese 50% – 70% are obese 40% are obese OBESITY
Trends in Cardiovascular Risk Factors in Obese Individuals (BMI ≥ 30 kg/m2 ) High Blood Pressure Smoking High Cholesterol Diabetes Gregg EW, et al. JAMA 2005;293:1868-1874.
Fat stores Obesity Is Caused by Long-Term Positive Energy Balance Energy expenditure Energy intake
Regulation of Body Weight • Genes confer the potential for obesity • Environment determines whether and to what extent the potential is realized
27 26 25 24 23 Fathers 22 Mothers 21 Relationship Between Adoptee Weight and Weight of Biological or Adoptive Parents Adoptive Parents Biological Parents BMI of Parents (kg/m2) Thin Median Overweight Obese Thin Median Overweight Obese Weight Classification of Adoptees Stunkard et al. N Engl J Med 1986;314:193.
Thermic effect of feeding Energy expenditure of physical activity Resting energy expenditure Components of Daily Energy Expenditure 8% 17% 8% 32% 75% 60% Sedentary person (1800 kcal/d) Physically active person (2200 kcal/d)
30 25 Cumulative Incidence of a 10-kg Body Weigh Gain (%) 20 15 10 5 0 Time (years) 2 3 4 0 1 Middle RMR High RMR Low RMR Decreased Energy Expenditures and Weight Gain RMR = resting metabolic rate Ravussin E, et al. N Engl J Med. 1988;318:467-472.
50 p < 0.0001 40 30 Pima Indians in 20 Maycoba, Mexico Pima Indians in Arizona 10 0 Gene-Environment Interaction in the Pathogenesis of Obesity Body Mass Index (kg/m2) Ravussin E et. al. Diabetes Care 17:1067, 1994.
The Toxic Environment Food is… • Highly accessible • Inexpensive • Advertised heavily • High fat, high sugar • Delicious
16 oz 32 oz 44 oz 52 oz 64 oz 1 oz ≈ 12 calories
1977-1978 1989-1991 1994-1998 20 15 10 Food Intake per Eating Occasion, oz 5 0 Salty Snacks Desserts Soft Drinks Fruit Drinks French Fries Ham- burgers Cheese-burgers Pizza Mexican Food Food Portion Size Trends Nielsen & Popkin, JAMA 2003.
40 NHES 1967-1970 35 NLSY 1990 30 25 Prevalence (%) 20 15 10 5 0 1 - 2 2 - 3 3 - 4 4 - 5 > 5 0 - 1 TV hours per day (youth report) Prevalence of Obesity by Hours of TV per Day NHES Youth Aged 12 to 17 in 1967-1970 and NLSY Youth Aged 10 to 15 in 1990
% of Children with Daily Physical Education American Academy of Pediatrics.
Responding To The Obesity Epidemic • Create a child-healthy environment • Banish junk food from schools • Reduce food ads directed at children • Increase opportunities for physical activity
Psychological Factors and Obesity •Moral problem? • Psychological problem? • Aesthetic problem? • Social and medical problem?
Psychosocial Status of Obese Individuals • Most obese individuals have normal psychological status • Persons who seek weight loss report greater distress • Patients at greatest risk of depression: • Women • Extreme obesity (BMI ≥ 40 kg/m2) • Binge eating disorder (BED) Friedman & Brownell. Psych Bull 1995;117:3-20.
Risk of Major Depression with Extreme Obesity Onyike, et al. Amer J Epidemiology 2003;158:1139-1147.
Bodily Pain and Depression in Obese Individuals (N = 306) Bodily Pain: BDI-II Score Fabricatore AF. Obes Surg 2005; 15:304-309.
Prejudice Against the Obese Six-year old children labeled silhouettes of an overweight child as: • Lazy • Dirty • Stupid • Ugly • Cheats • Lies Staffieri. J Per Social Psychol 1967;7:101.
Prejudice Against the Obese 1961 2001 1 Healthy* 2 Healthy Crutches Face* 3 Mean Rank Wheelchair Crutches* Hand Hand 4 Face Wheelchair* Obese 5 Obese* 6 Latner, JD, Stunkard, AJ. Obes Res 2003;11:454.
Discrimination Against the Obese • Discrimination has been reported in: • Student Selection • Employee Selection • Employee Pay and Promotion • Tenant Selection • Marriage Roehling MV. Personnel Psychology 1999; 52: 969-1016.
Discrimination in the Workplace • Discrimination against obese does not violate federal law in the US • Title VII in US protects people from discrimination based on race, color, religion, sex, or national origin • Obesity is not a protected characteristic
Social Stigma and Obesity: “I’d Rather Go Blind” • Patients who lost 45 kg or more • Preferred to be normal weight with a major handicap (deaf, dyslexic, diabetic, legally blind, bad acne, heart disease, leg amputated) than to be morbidly obese • Rather be normal weight than a morbidly obese multi-millionaire Rand CS. Macgregor AM. Int J Obesity 1991; 15:577.
Conclusion • The epidemic of obesity is the result of a complex interplay of genetic, environment, cultural, and economic factors • Greater efforts are needed to change the environment that lies at the heart of the epidemic • Obese individuals should not be blamed for their condition, but instead be treated with respect, fairness, and compassion