Download
1 / 1
10 likes | 140 Views
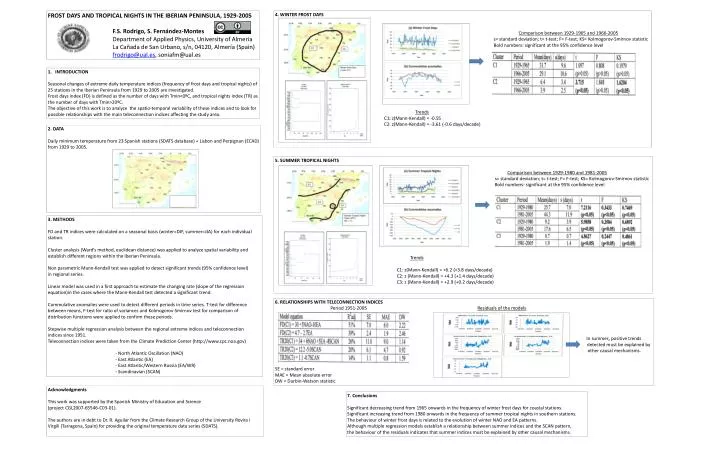
FROST DAYS AND TROPICAL NIGHTS IN THE IBERIAN PENINSULA, 1929-2005 F.S. Rodrigo, S. Fernández-Montes Department of Applied Physics , University of Almería La Cañada de San Urbano, s/n, 04120, Almería ( Spain ) frodrigo@ual.es , soniafm@ual.es.

E N D
FROST DAYS AND TROPICAL NIGHTS IN THE IBERIAN PENINSULA, 1929-2005 F.S. Rodrigo, S. Fernández-Montes Department of AppliedPhysics, University of Almería La Cañada de San Urbano, s/n, 04120, Almería (Spain) frodrigo@ual.es, soniafm@ual.es 4. WINTER FROST DAYS Comparisonbetween 1929-1965 and 1966-2005 s= standarddeviation; t= t-test; F= F-test; KS= Kolmogorov-Smirnovstatistic Boldnumbers: significant at the 95% confidencelevel Trends C1: z(Mann-Kendall) = -0.55 C2: z(Mann-Kendall) = -3.61 (-0.6 days/decade) INTRODUCTION Seasonalchanges of extreme dailytemperatureindices (frequency of frostdays and tropical nights) of 25 stations in theIberianPeninsulafrom 1929 to 2005 are investigated. Frostdaysindex (FD) isdefined as thenumber of dayswithTmin<0ºC, and tropical nightsindex (TR) as thenumber of dayswithTmin>20ºC. Theobjective of thisworkistoanalyzethespatio-temporal variability of theseindices and to look for possiblerelationshipswiththemainteleconnectionindicesaffectingthestudyarea. 2. DATA Dailyminimumtemperaturefrom 23 Spanishstations (SDATS database) + Lisbon and Perpignan (ECAD) from 1929 to 2005. 5. SUMMER TROPICAL NIGHTS Comparisonbetween 1929-1980 and 1981-2005 s= standarddeviation; t= t-test; F= F-test; KS= Kolmogorov-Smirnovstatistic Boldnumbers: significant at the 95% confidencelevel Trends C1: z(Mann-Kendall) = +6.2 (+3.8 days/decade) C2: z (Mann-Kendall) = +4.3 (+1.4 days/decade) C3: z (Mann-Kendall) = +2.9 (+0.2 days/decade) 3. METHODS FD and TR indiceswerecalculatedon a seasonalbasis(winter=DJF, summer=JJA) foreach individual station. Clusteranalysis (Ward’smethod, euclideandistance) wasappliedtoanalyzespatialvariability and establishdifferentregionswithintheIberianPeninsula. Non parametric Mann-Kendall test wasappliedtodetectsignificanttrends (95% confidencelevel) in regional series. Linear modelwasused in a firstapproachtoestimatethechangingrate (slope of theregressionequation)in the cases wherethe Mann-Kendall test detected a significanttrend. Cummulativeanomalieswereusedtodetectdifferentperiods in time series. T-test fordifferencebetweenmeans, F-test for ratio of variances and Kolmogorov-Smirnov test forcomparison of distributionfunctionswereappliedtoconfirmtheseperiods. Stepwisemultipleregressionanalysisbetweenthe regional extreme indices and teleconnection indicessince 1951. TeleconnectionindicesweretakenfromtheClimatePrediction Center (http://www.cpc.noa.gov) - North AtlanticOscillation (NAO) - East Atlantic (EA) - East Atlantic/Western Russia (EA/WR) - Scandinavian (SCAN) 6. RELATIONSHIPS WITH TELECONNECTION INDICES Period 1951-2005Residuals of themodels In summer, positive trendsdetectedmustbeexplainedbyother causal mechanisms. SE = standard error MAE = Mean absolute error DW = Durbin-Watson statistic Acknowledgments ThisworkwassupportedbytheSpanishMinistry of Education and Science (project CGL2007-65546-C03-01). Theauthors are in debtto Dr. R. Aguilar fromtheClimateResearchGroup of theUniversity Rovira i Virgili (Tarragona, Spain) forprovidingthe original temperature data series (SDATS). 7. Conclusions Significantdecreasingtrendfrom 1965 onwards in thefrequency of winterfrostdaysforcoastalstations. Significantincreasingtrendfrom 1980 onwards in thefrequency of summer tropical nights in southernstations. Thebehaviour of winterfrostdaysisrelatedtotheevolution of winter NAO and EA patterns. Althoughmultipleregressionmodelsestablish a relationshipbetweensummerindices and the SCAN pattern, thebehaviour of theresidualsindicatesthatsummerindicesmustbeexplainedbyother causal mechanisms.