Download
1 / 20
210 likes | 377 Views
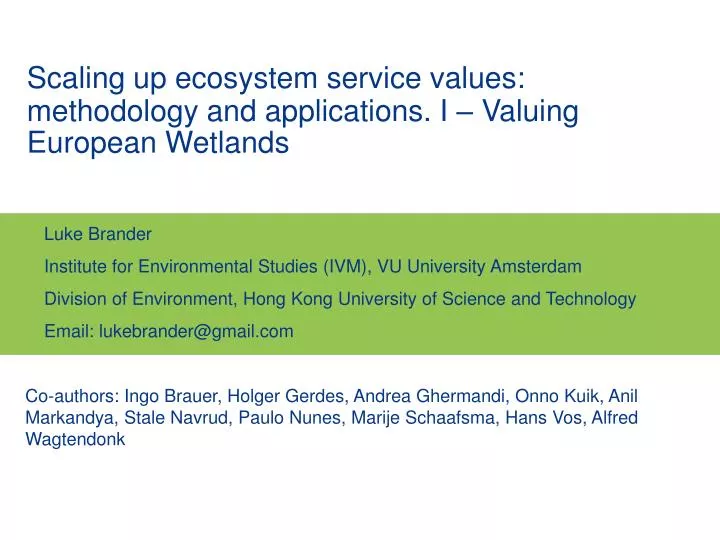
Luke Brander Institute for Environmental Studies (IVM), VU University Amsterdam Division of Environment, Hong Kong University of Science and Technology Email: lukebrander@gmail.com. Scaling up ecosystem service values: methodology and applications. I – Valuing European Wetlands.

E N D
Luke Brander Institute for Environmental Studies (IVM), VU University Amsterdam Division of Environment, Hong Kong University of Science and Technology Email: lukebrander@gmail.com Scaling up ecosystem service values: methodology and applications. I – Valuing European Wetlands Co-authors: Ingo Brauer, Holger Gerdes, Andrea Ghermandi, Onno Kuik, Anil Markandya, Stale Navrud, Paulo Nunes, Marije Schaafsma, Hans Vos, Alfred Wagtendonk
Outline • Introduction • Value transfer and scaling-up values • Methodology: meta-analysis and GIS • Case study: European wetlands under climate change • Conclusions and discussion
Introduction • Ecosystem services are generally public goods without market prices. • ES are generally valued on a limited spatial scale, e.g. individual ecosystems. • Need for value information at larger spatial scales, e.g. river basin, national, regional, global (e.g. TEEB). • What are the possibilities for scaling-up value information for large numbers of ecosystems?
Value transfer and scaling up • Value transfer: estimating the value of a ‘policy site’ using existing value information for a ‘study site’. • Scaling-up is value transfer to a larger geographic scale, e.g. to the entire stock of an ecosystem at a regional scale. • Value transfer is already complex: Need to account for differences in study and policy site characteristics.
Non-constant marginal values • Small changes in ecosystem size will not affect values from the rest of the ecosystem stock. • Larger scale changes may result in increasing marginal ecosystem service values. • Multiplying a constant unit value by total quantity will under-estimate total value. • Need to adjust marginal values to account for large-scale changes
Non-constant marginal values Critical threshold Under-estimate change in value PB PA € / ha Marginal value B A Area of ecosystem / Supply of services
Proposed method for scaling up values • Construct database of primary value estimates • Estimate value function (including ecosystem abundance variable) • Construct database of ecosystem sites using GIS • Estimate site-specific values (pre- and post-change) • Multiply site-specific values by change in site area • Aggregate to policy relevant spatial level Meta- analysis Spatial Data (GIS) Estimate values
Limitations to this method: • Critical ecological thresholds • Point at which an ecosystem ceases to function • High uncertainty • Limited value information for large scale changes • Available primary value estimates generally relate to current levels of overall service provision • The value of large changes in service provision are unknown Method is limited to measuring ‘small’ non-marginal changes in ecosystem extent.
Case study: Value of wetland loss under climate change • Meta-analytic value function for wetlands • Wetland change due to climate change in Europe • GIS data on wetland sites • Scaling-up value results
Meta-analysis of wetland values • Meta-analysis: statistical summary of results from existing studies • Wetland data from Brander et al. (2006); Ghermandi et al. (2007) • Temperate climate zone wetlands • 222 value observations • Focus on changes in area • Values for almost all ecosystem services • Standardised values to USD/ha/year 2005
Meta-analytic value function • Dependent variable y: Annual value ofwetland service(s) per hectare (USD 2005) • Study characteristics Xsi: • Valuation method • Wetland characteristics Xwi: • Size • Services provided • Wetland type • Context characteristics Xci: • GDP per capita (EU NUTS2; US State) • Population within 50km radius • Wetland abundance within 50km radius
European wetland change due to climate change • Numerous and complex impacts of CC on wetlands • Negative and positive impacts • Spatially explicit projections of wetland change are not available • Assume 8% loss in area 2000 - 2050 (Nicholls, 2004)
GIS – Spatial data on wetlands • Corine land cover data (EEA) • 50,533 wetlands in EU • Wetland size (ha) • Wetland type (5 categories) • Wetland abundance (within 50 km radius) • Population (within 50 km radius) • Income per capita (NUTS2 level)
Scaling up values • Substitute site specific variable values for 2000 and 2050 into value function. • Calculate average of 2000 and 2050 annual per ha values for each wetland. • Multiply by change in area to give value change per wetland.
Discussion and conclusions • Value transfer on a large scale • GIS based • Scale, substitutes, population, and income effects • Common problems of value transfer and meta-analysis hold: • Limited number of studies for some ES • Reliability of primary valuation estimates • Accounting for ecosystem quality • Limitations: • Does not produce service specific values • Data may not support service specific meta-analyses • Population and income effects are the same across all ES • Assume that supply of ES is proportional to ecosystem size