Download
1 / 26
260 likes | 490 Views
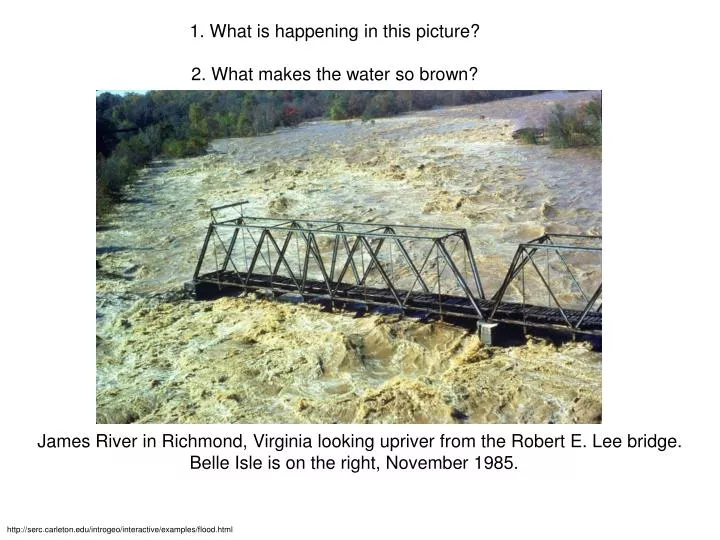
1. What is happening in this picture? 2. What makes the water so brown? . James River in Richmond, Virginia looking upriver from the Robert E. Lee bridge. Belle Isle is on the right, November 1985. . http://serc.carleton.edu/introgeo/interactive/examples/flood.html.

E N D
1. What is happening in this picture? 2. What makes the water so brown? James River in Richmond, Virginia looking upriver from the Robert E. Lee bridge. Belle Isle is on the right, November 1985. http://serc.carleton.edu/introgeo/interactive/examples/flood.html
3. Estimate the height of the river during the flood shown in the previous image. 4. How could we obtain or estimate past flooding? 5. How can we predict the future flood potential? James River in Richmond, Virginia. The Robert E. Lee bridge and the bridge in the previous photo are in the background. http://serc.carleton.edu/introgeo/interactive/examples/flood.html
6. Describe the shape of the bedrock river channel. 7. How were those holes formed? Potholes along the James River at Belle Isle, the same location as previous images. http://serc.carleton.edu/introgeo/interactive/examples/flood.html
Presidential disaster declarations related to flooding in the United States, shown by county, between June 1, 1965, and June 1, 2003 Floods are common and costly natural disasters Green: 1 declaration Yellow: 2 declarations Orange: 3 declarations Red: ≥4 declarations Map not to scale. Sources: FEMA, Michael Baker Jr., Inc., the National Atlas, and the USGS http://www.usgs.gov/hazards/images/maps/flood_hires.jpg
Floods are common and costly natural disasters Hurricane Katrina - largely from flood [rain and storm surge] damage $105 Billion http://en.wikipedia.org/wiki/Economic_effects_of_Hurricane_Katrina http://ks.water.usgs.gov/Kansas/pubs/fact-sheets/fs.024-00.html
Drainage Basin http://www.lpb.org/education/tah/Workshop111905_files/slide0034_image009.jpg http://wps.prenhall.com/wps/media/tmp/labeling/390600_dyn.jpg
Meandering river carve out the flood plain Flood plains normally are dry http://www.uwm.edu/Course/geosci697/rivers-deltas/ http://pubs.usgs.gov/fs/OFR93-641/ http://www.uwsp.edu/geo/faculty/ritter/geog101/uwsp_lectures/lecture_fluvial_processes.html
Map of real-time streamflow compared to historical streamflow for the day of the year http://water.usgs.gov/waterwatch/index.php?map_type=real&state=nj
Stream Discharge (Q) Hydrograph Q = A X V Lag time http://www.uwsp.edu/geo/faculty/ritter/geog101/uwsp_lectures/lecture_fluvial_processes.html
Weather patterns can determine when floods occur http://pubs.usgs.gov/fs/OFR93-641/
steep topography + intense rain = short lag time = “Upstream” (flash flood) flood August 1, 1976 7.5 inches of rain in 70 minutes flood water velocity of 23 ft/sec The Big Thompson Canyon flood killed 145 people, destroyed 418 houses and damaged another 138, destroyed 152 businesses and caused more than $40 million in damages. http://www.super70s.com/Super70s/Tech/Nature/Disasters/Floods/76July31-Big_Thompson.asp
Affect of Urbanization on Flooding Streamflow in Mercer Creek, an urban stream in western Washington, increases more quickly, reaches a higher peak discharge, and has a larger volume during a one-day storm on February 1, 2000, than streamflow in Newaukum Creek, a nearby rural stream. Streamflow during the following week, however, was greater in Newaukum Creek. What is it about urbanization that is problematic? http://www.geo.hunter.cuny.edu/bight/chap9.html http://pubs.usgs.gov/fs/fs07603/
What parameters influence flooding? • Weather patterns – precipitation, snow melt • Topography (steep or flat) • Properties of the soil (porous and permeable) • Land use (impervious covers, channalization) • All come down to: surface runoff >> infiltration increase flood potential
Very large floods happen very seldom The extrapolations of recurrence intervals are used to forecast the future probability of a flood of a given discharge. The probability (P) of an flood with recurrence interval T is P = 1/T “The 100 year flood” A flood discharge that has a 100-year recurrence interval has a 1% chance of occurring or being exceeded in a given year. Flood Frequency Diagram http://serc.carleton.edu/quantskills/methods/quantlit/floods.html
The stage of such a flood can be back-calculated using the rating curve for the river. Once the stage is known, a topographic map can be consulted to examine inundation http://www.nws.noaa.gov/oh/Dis_Svy/RedR_Apr97/graphics/Fig2.gif
Retention ponds can reduce floods Wetlands (veg.) can reduce floods http://www.dnr.wa.gov/htdocs/lm/field_guides/recognizing/functions.html
Zoning restrictions limit flood damage Dams and levees can reduce the risk of floods Floodwalls along Willow Creek in Rosemont, Illinois. Source: Kevin D. Richards, U.S. Geological Survey. http://pubs.usgs.gov/fs/OFR93-641/ http://pubs.usgs.gov/fs/fs07603/
http://www.macchuck.com/KATRINA/GALLERIES/info/ElevationMap.htmlhttp://www.macchuck.com/KATRINA/GALLERIES/info/ElevationMap.html
A map from the U.S. Army Corps of Engineers sets out areas of flooding in New Orleans following Katrina, Sept. 2. http://www.npr.org/templates/story/story.php?storyId=4826934
Levees (and channalization) can constrict a river, increasing flow velocities and causing flooding upstream and downstream http://www.friendsoftheriver.org/Publications/BeyondFloodControl/no6.html
http://www.friendsoftheriver.org/Publications/BeyondFloodControl/no8.htmlhttp://www.friendsoftheriver.org/Publications/BeyondFloodControl/no8.html
http://ks.water.usgs.gov/Kansas/pubs/fact-sheets/fs.024-00.htmlhttp://ks.water.usgs.gov/Kansas/pubs/fact-sheets/fs.024-00.html