Download
1 / 13
140 likes | 284 Views
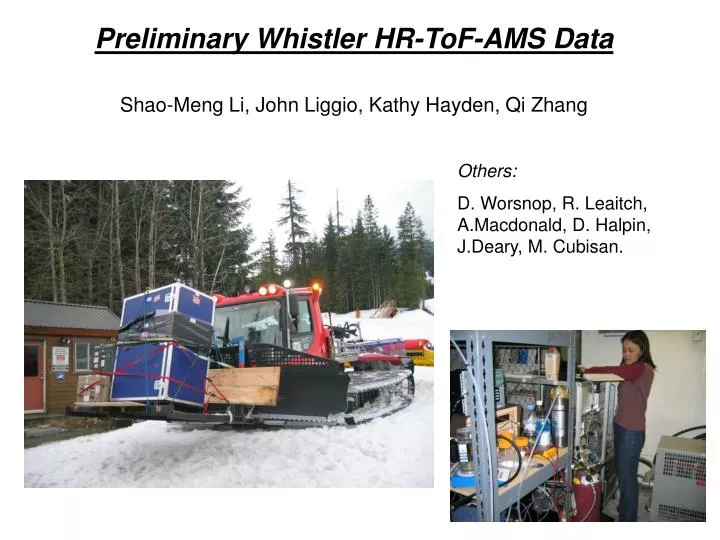
Preliminary Whistler HR-ToF-AMS Data Shao-Meng Li, John Liggio, Kathy Hayden, Qi Zhang. Others: D. Worsnop, R. Leaitch, A.Macdonald, D. Halpin, J.Deary, M. Cubisan. ToF-AMS Instrument Details. Provides detailed particle mass spectra with high time resolution ( 5 min @ whistler)

E N D
Preliminary Whistler HR-ToF-AMS DataShao-Meng Li, John Liggio, Kathy Hayden, Qi Zhang Others: D. Worsnop, R. Leaitch, A.Macdonald, D. Halpin, J.Deary, M. Cubisan.
ToF-AMS Instrument Details • Provides detailed particle mass spectra with high time resolution ( 5 min @ whistler) • Quantifies particle sulfate, nitrate, ammonium, and total organic mass (< ~1 um diameter) • Quantification based on relative Ionization efficiency (IE) • size segregated mass distribution for every m/z • Higher mass range than Q-AMS (~800 amu) • Two modes of operation: • V-mode: High sensitivity (20X more than Q-AMS), better than unit mass resolution • W-mode: Lower sensitivity (~same as Q-AMS), high mass resolution (~5000 vs 20 for the Q-AMS) • Alternated between modes (5 min each)
Status of HR-ToF data • April 19 @18:20 – May 16 @18:35, ~66% data recovery, data gaps due to many different instrument problems • Particle concentrator was used intermittently • Concentrator on/off time periods in the data have been defined • Δ[SO42-] used as indicator and to determine enhancement factor • Ionization efficiency (IE) nominally determined, nominal factors have been applied to data • Particle time-of-flight calibration function analyzed, but size distributions need work – (need to develop a routine to minimize effect of noisy m/z’s)
Whistler HR-ToF AMS April-May 2006 Asian Dust Courtesy: Peter Liu
Vmode concentrator on Not corrected for concentrator enhancement factor
Case 1: Case 2: * Case 1: Possible Transport Layer High sulphate, May 15 morning to afternoon Transport Layer Case 2: Possible Valley Influence (biogenic component?) High organics, May 15 evening to May 16 evening
2 1 Oxygenated organics (CO2+) C4H9+, C3H5O+ Biogenic signature
Cessna 207 Aircraft ProfilesFlight 30, May 15, late evening (~6pm) UP DOWN • boundary layer ~2000 m • SO42- increased between 2600-2900 m, above boundary layer (UP) • layered elevated organics: 2200-2900m and 3000-4000 m • at tail end of high SO42- observed at Whistler site (Case 1) • transport layer
Path Forward • Quantify biogenic sulphur – ie: MSA in particles with AMS
Path Forward… • Quantify the biogenic component of aerosols at whistler • Use ToF-AMS data to infer particle sources • - Principal component analysis (PCA)